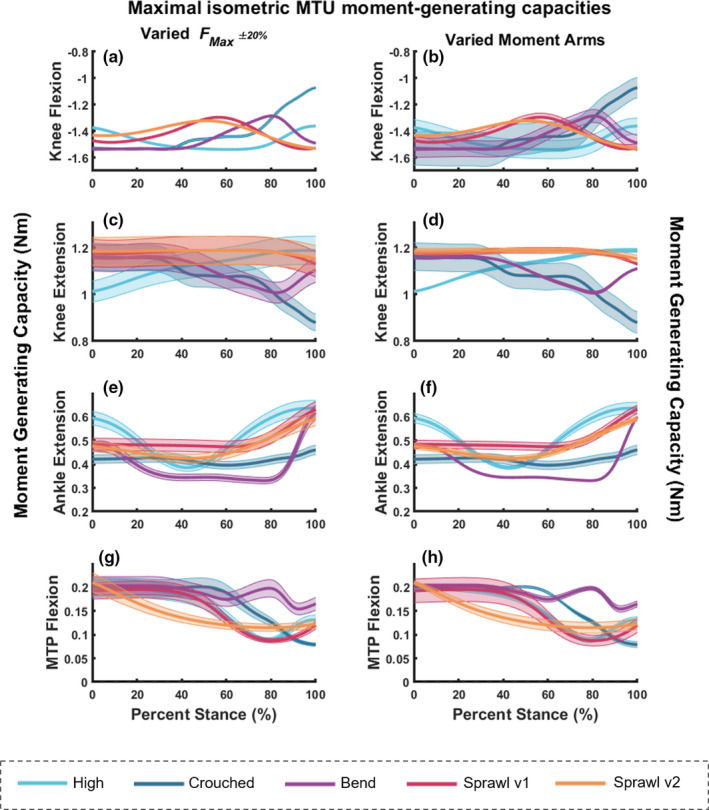
FIGURE 9.

Maximal isometric MTU moment‐generating capacities about the knee (a and b for flexion and c and d for extension), ankle extensors (e and f) and MTP flexors (g and h) for the five behaviours during stance only. Graphs on the left (a, c, e and g) represent the estimated moment values from OpenSim with the simulated error margins using (see Methods). Graphs on the right (b, d, f and h) also represent the estimated moment values from OpenSim, but instead with the simulated error (up to 20% error) using the moment arms varied in the Monte Carlo analysis, which were then used to calculate the isometric moments
