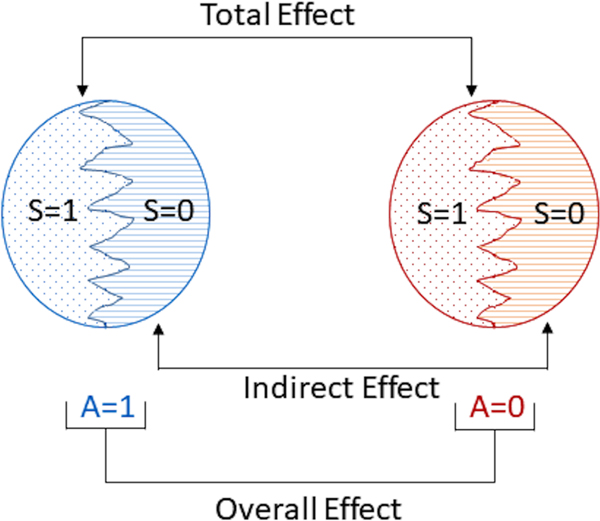
FIGURE 1.
Cluster counterfactual comparisons. The left circle represents a cluster if, possibly counter to fact, assigned to vaccine (A = 1). The right circle represents a cluster if, possibly counter to fact, assigned to control (A = 0). Within each circle, S indicates which individuals chose to participate in the study (S = 1 indicates participation, S = 0 otherwise). The overall, indirect, and total effects are contrasts in average potential outcomes over different sets of individuals within the clusters

