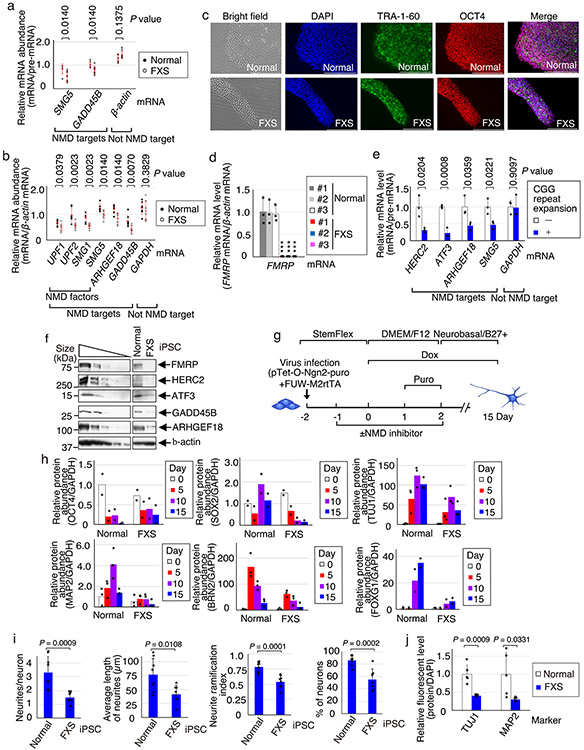
Extended Data Fig. 7 ∣. NMD is hyperactivated in FXS lymphoblasts, and characterization of iPSCs derived from healthy or FXS cells.
a, As in Fig. 4a, dot plots of RT-qPCR quantitations of the specified mRNA, normalized to the level of its pre-mRNA, using lysates from healthy (i.e. normal) or FXS lymphoblasts. Red bars represent means with S.D, where n = 6 independent biological cell lines. P values were calculated in comparisons of normal vs. FXS samples (two-sided Wilcoxon rank-sum test). b, as in a, but normalized to the level of ß-actin mRNA. Red bars, means with S.D., n = 6 independent biological cell lines. P values were calculated in comparisons of normal vs. FXS samples (two-sided Wilcoxon rank-sum test). c, Bright-field and IF images of iPSCs from a representative normal or a representative FXS patient-derived cell line for validation purposes. For IF, FXS iPSCs were stained for TRA-1-60 (green) or OCT4 (red), each of which is a pluripotent marker. Scale bar, 200 μm. Results are representative of 3 independent biological replicates. d, as in Fig. 4b, but normalized to the level of ß-actin mRNA. Means with S.D., where n = 3 biologically independent replicates. (***) P < 0.001 are relative to Normal #1 samples (one-way ANOVA and Dunnett’s multiple comparison test). e, As in Fig. 4b but for isogenic iPSCs + or − CGG repeat expansion. Means with S.D., where n = 3 independent biological replicates. P values were calculated in comparisons of + vs. − CGG repeat expansion (two-sided t-test). f, Western blots of lysates of normal and FXS iPSCs from Fig. 4b. Results are representative of 3 independent biological replicates. g, Protocol of neural differentiation − or + an NMD inhibitor. h, Quantitations of western blots shown in Fig. 4c. i, FXS iPSC-derived neurons exhibit deficient neurite formation on day 7 of differentiation. βIII-tubulin staining of normal and FXS neurons derived from iPSCs was used to assess neurite formation, average neurite length, neurite ramification, and neuronal differentiation efficacy. Means with S.D., where n = 8 independent biological replicates. P values were calculated in comparisons of normal vs. FXS samples (two-sided t-test). j, Quantitations of IF shown in Fig. 4d. Results are means with S.D., where n = 5 independent biological replicates. P values were calculated in comparisons of normal vs. FXS samples (two-sided t-test). Statistical source data and unprocessed blots are provided in Source Data Extended Data Fig. 7.

