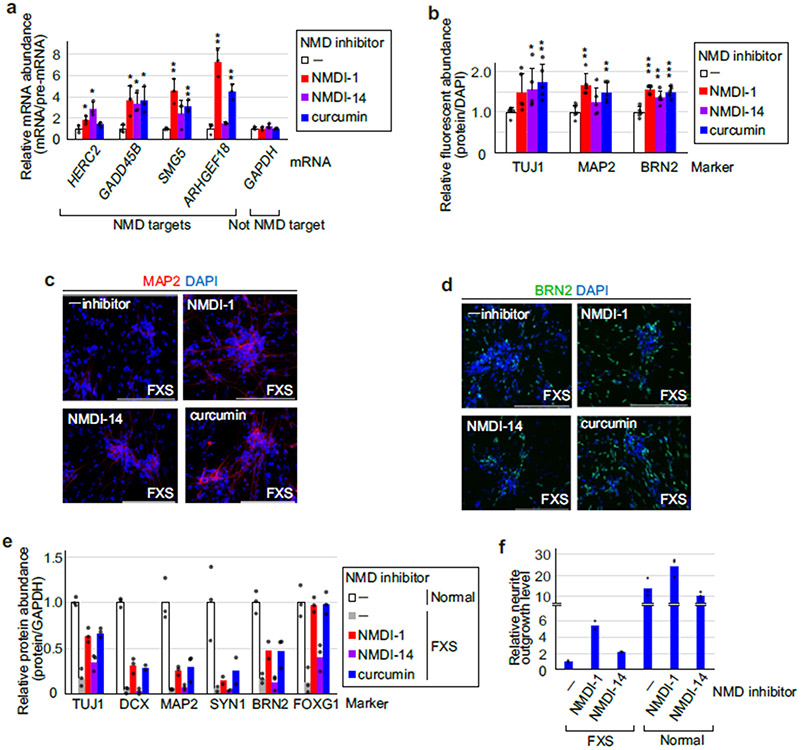
Extended Data Fig. 8 ∣. RT-qPCR and IF demonstrating that NMD inhibitors partially normalize FXS-derived iPSC differentiation.
a, Quantitations demonstrating that NMD was inhibited by each of the 3 NMD inhibitors. Samples derived from day 0, that is 24-hr after culturing iPSCs in the presence of each inhibitor as shown in Fig. 4e, b, Results are means with S.D., where n = 3 independent biological replicates. (*) P < 0.05 or (**) P < 0.01 is relative to RNA samples without NMD inhibitor (two-sided t-test). b, As in Extended Data Fig. 7j, but with or without an NMD inhibitor. Means with S.D., where n = 5 independent biological replicates. (*) P < 0.05, (**) P < 0.01 or (***) P < 0.01 is relative to RNA samples without an NMD inhibitor (two-sided t-test). c, As in Fig. 4e, but staining for MAP2 (red). d, As in Fig. 4e, but staining for BRN2/POU3F2 (green). Results are representative of 3 independent biological replicates in (c) and (d). e, Histogram representations of quantitations of western blots shown in Fig. 4f. Results represent n = 3 independent biological replicates, except for SYN1 analyses in FXS neurons, BRN2 analysis in FXS neurons treated with NMDI-1, and DCX analysis in FXS neurons treated with curcumin, where n = 2 independent biological replicates. f, Histogram representation of neurite outgrowth manifested by representative normal or FXS neurons on day 15 after differentiation. Results represent 2 independent biological replicates for FXS neurons and 3 independent biological replicates for normal neurons. All cells were stained for viability, and fluorescent signals derive from minimally 4 fields per well, where the extent of fluorescence for FXS neurons in the absence (−) of inhibitor is defined as 1. Statistical source data are provided in Source Data Extended Data Fig. 8.

