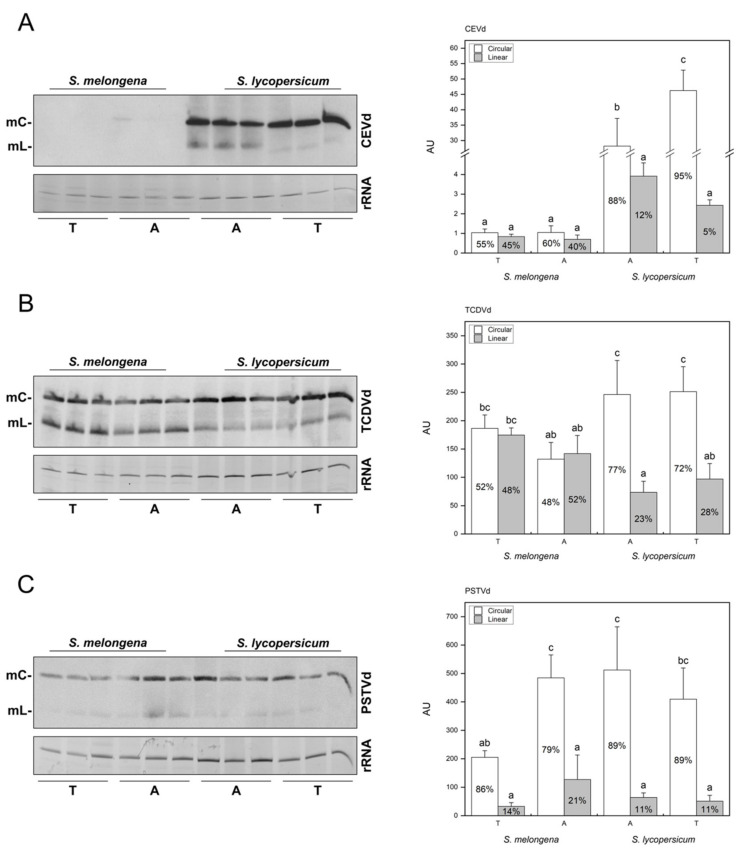
Figure 3.
Viroid accumulation in S. lycopersicum and S. melongena. Northern blot assay and quantification for detecting plus polarity circular (mC) and linear (mL) viroid molecules in systemic tissue of transcript-inoculated plants (T) or by agro-inoculation and quantification of viroid accumulation in infected plants for CEVd (A), TCDVd (B), and PSTVd (C). Bars correspond to absolute AU values, and percentage of each form over total viroid values are printed inside the bars. Data correspond to the mean ± SD of 3 biological replicates. Results were analyzed using an ANOVA test with a Tukey post-hoc, and different letters indicate significant differences (p ≤ 0.05).

