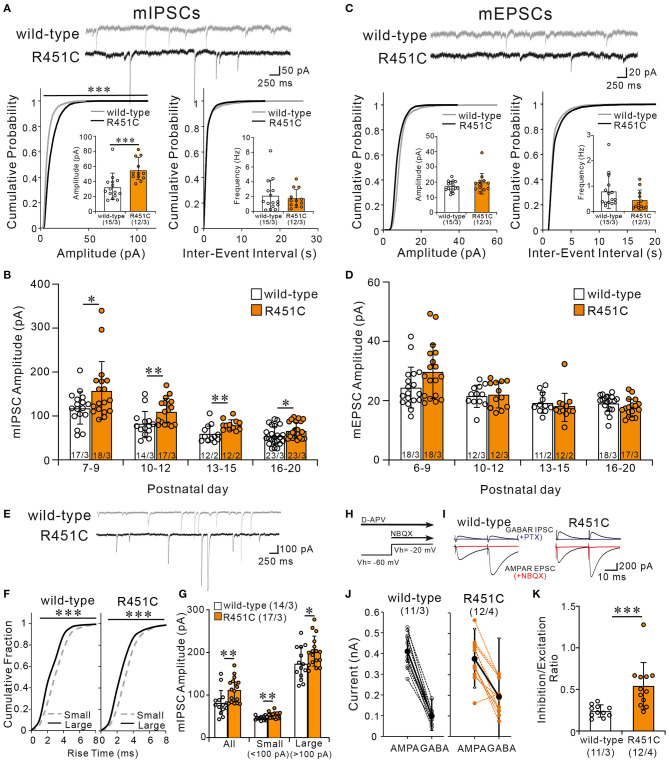
Figure 6.
The NLGN3-R451C mutation causes the enhancement of inhibitory synaptic transmission and the elevation of inhibition/excitation ratio of synaptic inputs to PCs. (A) Representative traces of mIPSC recorded from PCs of wild-type (upper trace) and NLGN3-R451C mutant (lower trace) mice (top) at Vh of −70 mV in the presence of 1 μM tetrodotoxin, 10 μM NBQX, and 5 μM R-CPP (N = 3/group). Scale bars, 250 ms and 50 pA. Cumulative distribution plots and summary bar graphs for the mIPSC amplitude (lower left; inset shows the average mIPSC amplitude) and for the inter-event interval (lower right; inset shows the average mIPSC frequency) in PCs of wild-type and NLGN3-R451C mutant mice aged P21–P35. For the mIPSC amplitude, ***p < 0.0001 by Kolmogorov-Smirnov test in the cumulative distribution plot and ***p = 0.0002 by Mann-Whitney U test in the bar graph. For the inter-event interval, p = 0.99 by Kolmogorov-Smirnov test in the cumulative distribution plot and p = 0.9 by Mann-Whitney U test in the bar graph. (B) Summary graph for the mIPSC amplitude of wild-type (open columns) and NLGN3-R451C mutant (orange columns) mice at indicated ages. Note that the mean amplitudes of mIPSCs in NLGN3-R451C mutant mice are significantly larger than those of wild-type mice during postnatal development (P7–P9, *p = 0.029; P10–P12, **p = 0.0053; P13–P15, **p = 0.0083; P16–P20, *p = 0.024 by Mann-Whitney U test). (C) Representative traces of mEPSC recorded from PCs of wild-type (upper trace) and NLGN3-R451C mutant (lower trace) mice (top) at Vh of −70 mV in the presence of 1 μM tetrodotoxin and 100 μM PTX (N = 3/group). Scale bars, 250 ms and 20 pA. Cumulative distribution plots for the mEPSC amplitude (lower left; inset shows the average mEPSC amplitude) and for the inter-event interval (lower right; inset shows the average mEPSC frequency) in PCs of wild-type and NLGN3-R451C mutant mice aged P21–P35. For the mEPSC amplitude, p = 0.17 by Kolmogorov-Smirnov test in the cumulative distribution plot and p = 0.40 by Mann-Whitney U test in the bar graph. For the inter-event interval, p = 0.84 by Kolmogorov-Smirnov test in the cumulative distribution plot and p = 0.59 by Mann-Whitney U test in the bar graph. (D) Summary graph for the mEPSC amplitude of wild-type (open columns) and NLGN3-R451C mutant (orange columns) mice at indicated ages (P6–P9, p = 0.074; P10–P12, p = 0.76; P13–P15, p = 0.350; P16–P20, p = 0.10 by Mann-Whitney U test). (E) Representative traces of mIPSC recorded from PCs of wild-type (upper) and NLGN3-R451C mutant (lower) mice at P10 in the presence of 1 μM tetrodotoxin, 10 μM NBQX, and 5 μM R-CPP. Vh = −70 mV. Scale bars, 250 ms and 100 pA. (F) Cumulative fractions of the rise time of small (<100 pA) (gray dotted line) and large (>100 pA) (black line) mIPSCs in wild-type (left) and NLGN3-R451C mutant (right) mice from P10 to P12. ***p < 0.0001 by Kolmogorov-Smirnov test for both genotypes. (G) Summary bar graphs for the mIPSC amplitude for all, small and large events in wild-type (open columns) and NLGN3-R451C mutant (orange columns) mice from P10 to P12. **p = 0.0053 (All); **p = 0.0014 (Small); *p = 0.0484 (Large) by Mann-Whitney U test. (H) Experimental protocol used to measure the inhibition/excitation ratio. (I) Representative traces of evoked AMPAR- and GABAAR-mediated synaptic currents in wild-type (left) and NLGN3-R451C mutant (right) mice. Scale bars, 10 ms and 200 pA. (J) Amplitudes of AMPAR- (left) and GABAAR- (right) mediated synaptic currents from wild-type (black) and NLGN3-R451C mutant (orange) mice. (K) Average inhibition/excitation ratio from wild-type (open column) and NLGN3-R451C mutant (orange column) mice aged P19–P25. ***p = 0.0004 by Mann-Whitney U test. Data are expressed as mean ± SD. Total number of cells recorded/total number of mice used is indicated within or beneath individual columns.

