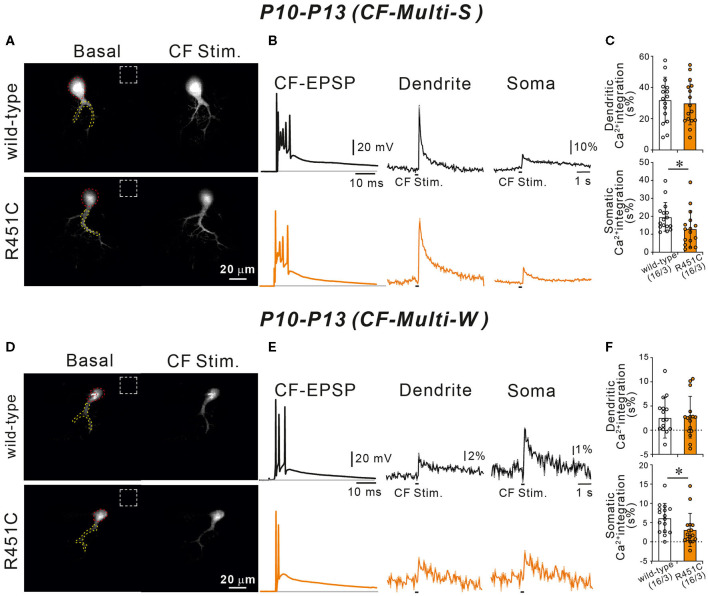
Figure 7.
Ca2+ transients induced by strong and weak CF inputs are smaller in NLGN3-R451C mutant mice than in wild-type mice. (A) Representative images of a wild-type (upper left) and a NLGN3-R451C mutant (lower left) PC. Areas demarcated by red and yellow dotted lines represent ROIs for somatic and dendritic Ca2+ transients, respectively. Dashed rectangles represent the ROIs where the background fluorescence signals were measured. Scale bar, 20 μm. (B) Representative traces of CF-induced EPSP (right) and those of Ca2+ transients recorded in the dendrite (middle) and the soma (right) of multiply-innervated PCs in response to stimulation of the strongest CF in wild-type (black) and NLGN3-R451C mutant (orange) mice. Scale bars, 20 mV and 10 ms for CF-EPSC, 10% and 1 s for Ca2+ transients. (C) Average magnitudes of Ca2+ transients from the soma and the dendrite by stimulating the strongest CF in wild-type (open columns) and NLGN3-R451C mutant (orange columns) mice. p = 0.77 (Dendrite) and *p = 0.026 (Soma) by Mann-Whitney U test. (D) Representative images of a wild-type (upper left) and a NLGN3-R451C mutant (lower left) PC shown similarly to (A). Scale bar, 20 μm. (E,F) Representative traces (E) and average magnitudes of Ca2+ transients (F) shown similarly to (A,B), respectively, but for responses to stimulation of a weak CF of a multiply innervated PC. Scale bars, 20 mV and 10 ms for CF-EPSC, 2% or 1% and 1 s for Ca2+ transients. p = 0.86 (Dendrite) and *p = 0.015 (Soma) by Mann-Whitney U test. Data for (A–F) were obtained from P10 to P13 mice. Data in (C,F) are expressed as mean ± SD. Numbers of PCs/mice are shown in parentheses.

