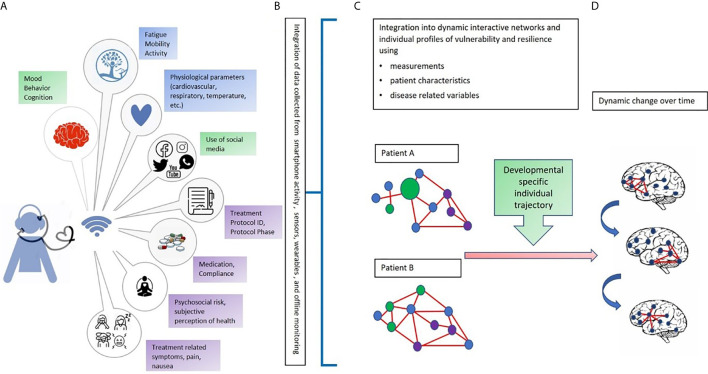
Figure 1.
An integrated multi-dimensional model for the use of digital phenotyping as part of a digital “toolbox” to be used in adolescents with cancer. Our hypothetical model is defined over four phases: (A) The data collection phase: In green: Objective continuous non-invasive data collection related to mood, behavior, cognition, and use of social media (using a digital phenotyping app); in blue: Objective continuous non-invasive collection of biomarkers from sensors and wearables (heartrate, blood pressure, temperature); in purple: Periodic collection of subjective perceptions and impressions related to mental and physical wellbeing (e.g., diaries, self-reports, and questionnaires) and type of treatment, protocol, and protocol phase; (B) The data transformation phase, that is, the conversion of raw data into usable algorithms and outputs to feed data analysis and network construction; (C) Creation of individual networks based on data from different dimensions and domains to understand the strengths and needs of each patient. The circles represent signs, symptoms, and factors related to the domains of data collection (green, blue, and purple). The red lines represent the connections among signs, symptoms, and factors; (D) Development of dynamic networks to monitor change over time in network organization and connectivity aimed at identifying windows of vulnerability and resilience. Letters and colors refer to those shown in the figure.

