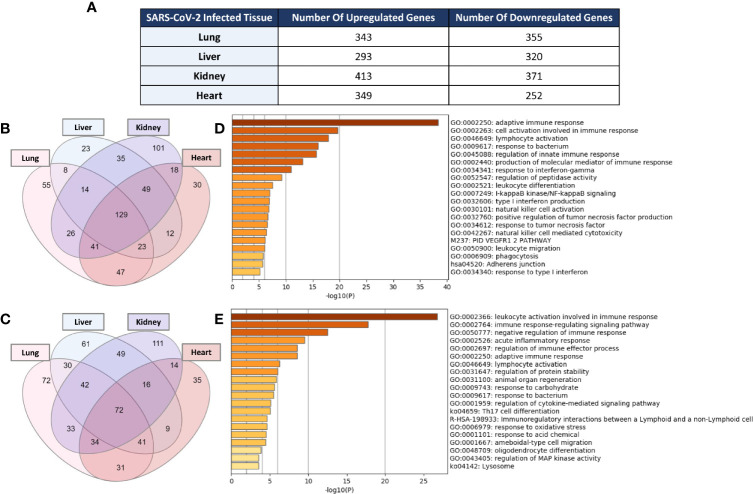
Figure 1.
(A) Count of differentially expressed immune response genes from the immune response gene ontology set (GO:0006955) in SARS-CoV-2 infected lung, liver, kidney, and heart tissues. Venn diagram representation of the overlap of significantly (B) upregulated and (C) downregulated immune response genes amongst the four types of infected tissues. Functional clustering and pathway analysis of the commonly (D) upregulated and (E) downregulated genes across lung, liver, kidney, and heart tissues in response to SARS-CoV-2 infection.

