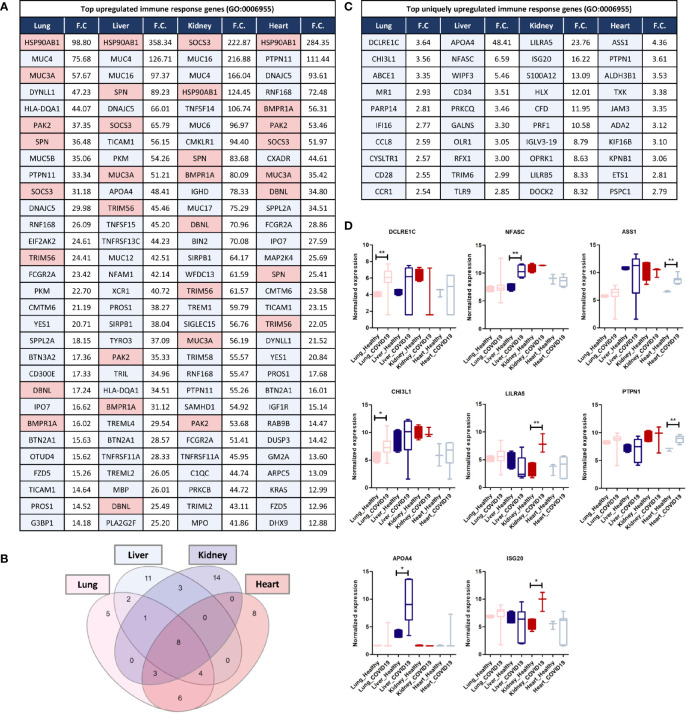
Figure 5.
(A) Top 30 upregulated immune response genes in lung, liver, kidney, and heart tissues in response to SARS-CoV-2 infection; F.C.: fold change; light red represents commonly upregulated genes within the top 20 genes across the 4 types of tissues. (B) Venn diagram representation of the overlap between the top 20 upregulated immune response genes in each tissue, enlisted in (A). (C, D) Top Immune response genes uniquely upregulated in lung, liver, kidney, and heart tissues in response to SARS-CoV-2 infection. * represents p-value < 0.05; ** represents p-value < 0.01 analyzed using T-test statistical analysis.

