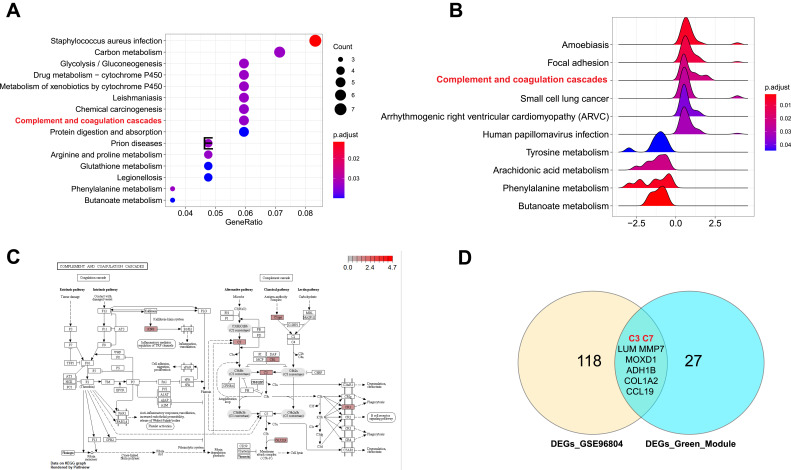
Figure 3.
Complement and coagulation cascades was significantly activated in DN. (A) The top 10 significant KEGG pathways in GSE96804 dataset. (B) GSEA analysis of GSE96804 dataset. (C) The pathway map of Complement and coagulation cascades. The red squares represent upregulated genes. (D) The Venn map of common DEGs between GSE30528 green module and GSE96804 dataset.

