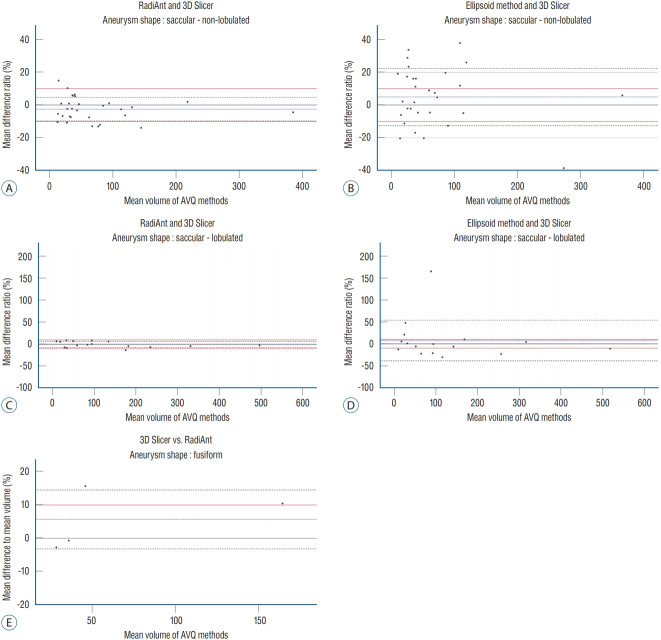
Fig. 5.
Comparison of Bland-Altman plots by different aneurysm shapes. The standard deviation in Bland-Altman plots of RadiAnt-3-dimensional (3D) slicer is within 10% of mean volume difference in both non-lobulated and lobulated aneurysm shape (A and C). On the contrary, the standard deviation in Bland-Altman plots of ellipsoid method-3D slicer is beyond 10% of mean volume difference (B and D). Bland-Altman plots of RadiAnt-3D slicer in fusiform aneurysm is also demonstrated to show that current aneurysm volume quantification method is also applicable in fusiform aneurysm (E). Red line : reference line of 10% volume difference, Black broken line : standard deviation, Blue broken line : mean volume difference to mean volume in percentile.

