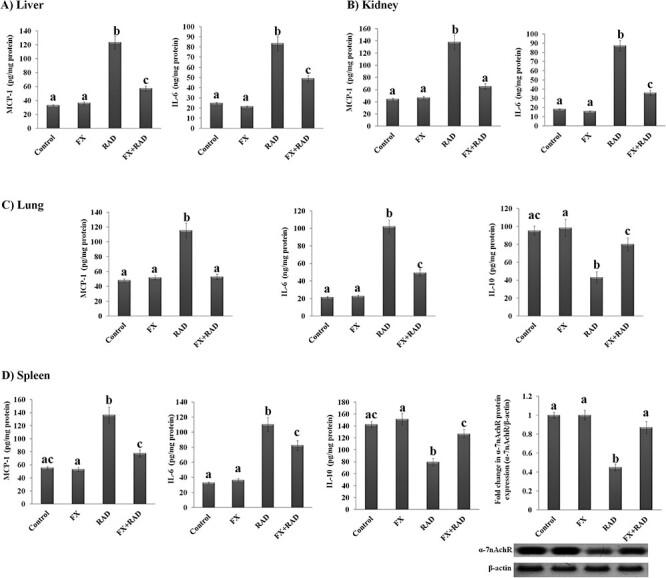
Fig. 2.

Impact of FX on inflammatory responses in (A) liver (MCP-1 and IL-6), (B) kidney (MCP-1 and IL-6), (C) lung (MCP-1, IL-6 and IL-10) and (D) spleen (MCP-1, IL-6 and IL-10) with representative western blot analysis of α-7nAchR (54 kDa) with its SDS–PAGE normalized to β-actin (43 kDa) protein expression in γ-irradiated mice. Data are expressed as mean values ± SEM (n = 6 independent values). Columns with different letters (a, b, c…) within the same histogram are significantly different and columns havimg the same letters are not significantly different at P < 0.05. Control group, normal mice; RAD group, mice exposed to γ-radiation; FX group, mice treated with fucoxanthin; and FX + RAD group, mice treated with FX and exposed to γ-radiation.
