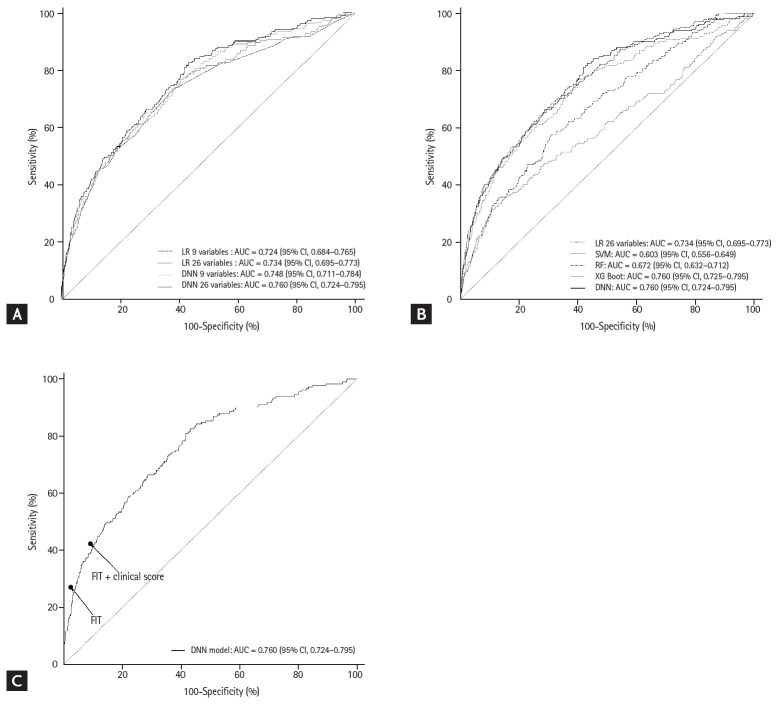
Figure 3.
Receiver operating characteristic curve and area under the receiver operating characteristic curve (AUC) of various prediction models for advanced colorectal neoplasia. (A) Logistic regression (LR) and deep neural network (DNN) models with 9 and 26 variables. (B) LR, support vector machine (SVM), random forest (RF), extreme gradient boosting (XGBoost), and DNN models using 26 variables. (C) DNN model compared with fecal immunochemical testing (FIT) and combined FIT and clinical risk score. CI, confidence interval.

