Figure 5.
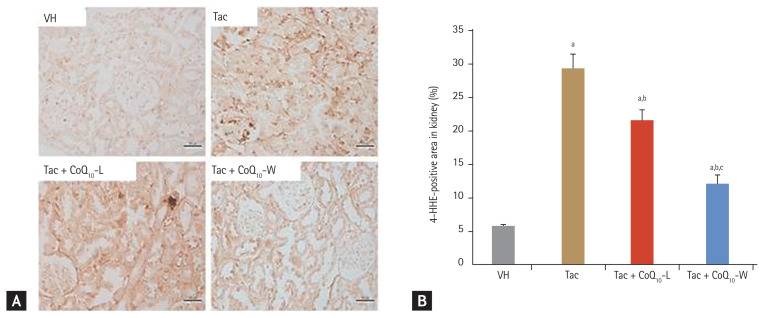
Comparison of the expression of 4-hydroxy-2-hexenal (4-HHE) between CoQ10-W and CoQ10-L in chronic tacrolimus (Tac) nephropathy. Representative photomicrographs of immunohistochemistry for 4-HHE in experimental groups (A) and semi-quantitative analysis (B). Data are presented as the mean ± standard error (n = 9). Scale bar = 100 μm. One-way analysis of variance was used to analyze the data. VH, vehicle; CoQ10, coenzyme Q10; Tac + CoQ10-L, co-treatment with lipid-soluble coenzyme Q10; Tac + CoQ10-W, co-treatment with water-soluble coenzyme Q10. ap < 0.05 vs. the VH group, bp < 0.05 vs. the Tac group, cp < 0.05 vs. the Tac + CoQ10-L group.

