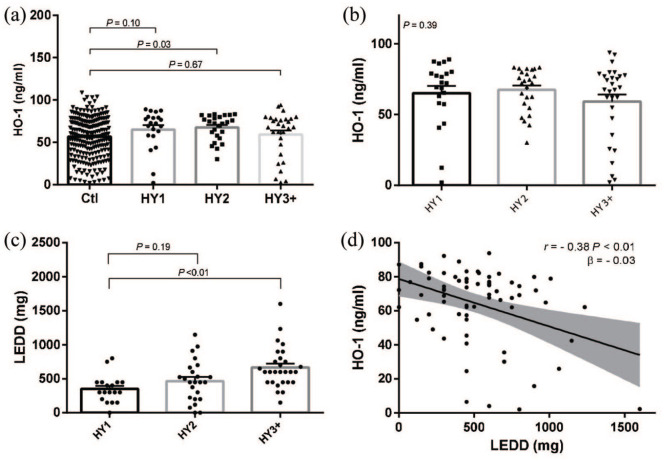
Figure 4.
Relationship between HO-1, LEDD and HY stage. Disease progression measured by H&Y scale progression. A) HO-1 protein levels of all non-PD controls (n=232) relative to PD cases subdivided into their h&Y stage (HY1 n=18, HY2 n=24, HY3 n=28) and B) HO-1 protein levels and c) LEDD levels among PD patients (n=70) subdivided into their H&Y stage. Statistical analyses were conducted with a=0.05, error bars indicate the mean with SEm. D) Linear regression analysis of LEDD and salivary HO-1 and Pearson correlation.

