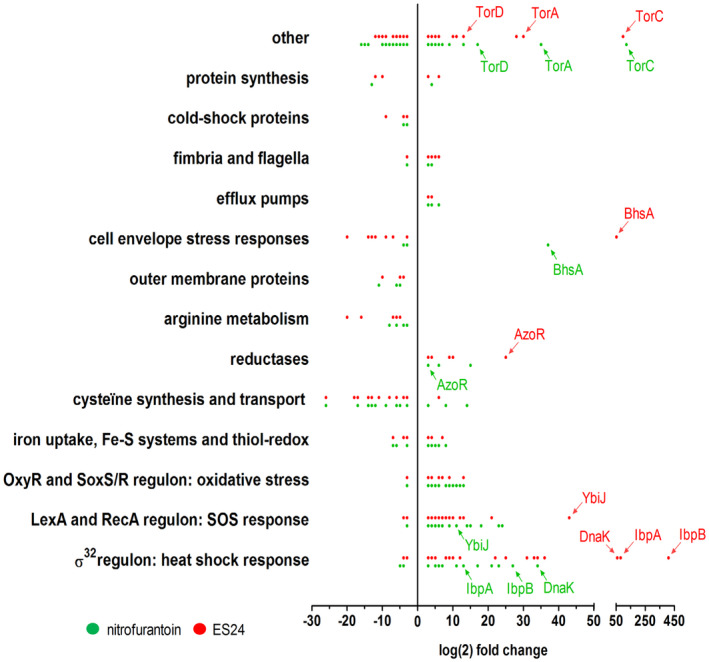
FIGURE 5.

NFT and ES24 induce a broad range of stress responses. Transcriptomic profile of differentially expressed genes in E. coli MC4100 treated with either 0.5× MIC ES24 (red dots) or NFT (green dots) compared to DMSO‐treated cells. Indicated are the transcripts that showed a log(2) fold‐change of ≥3 (p < .05). Genes are clustered into functional groups or regulons with each dot representing a gene, of which some are annotated. See supporting information for full transcriptomic analysis (Table S3) [Colour figure can be viewed at wileyonlinelibrary.com]
