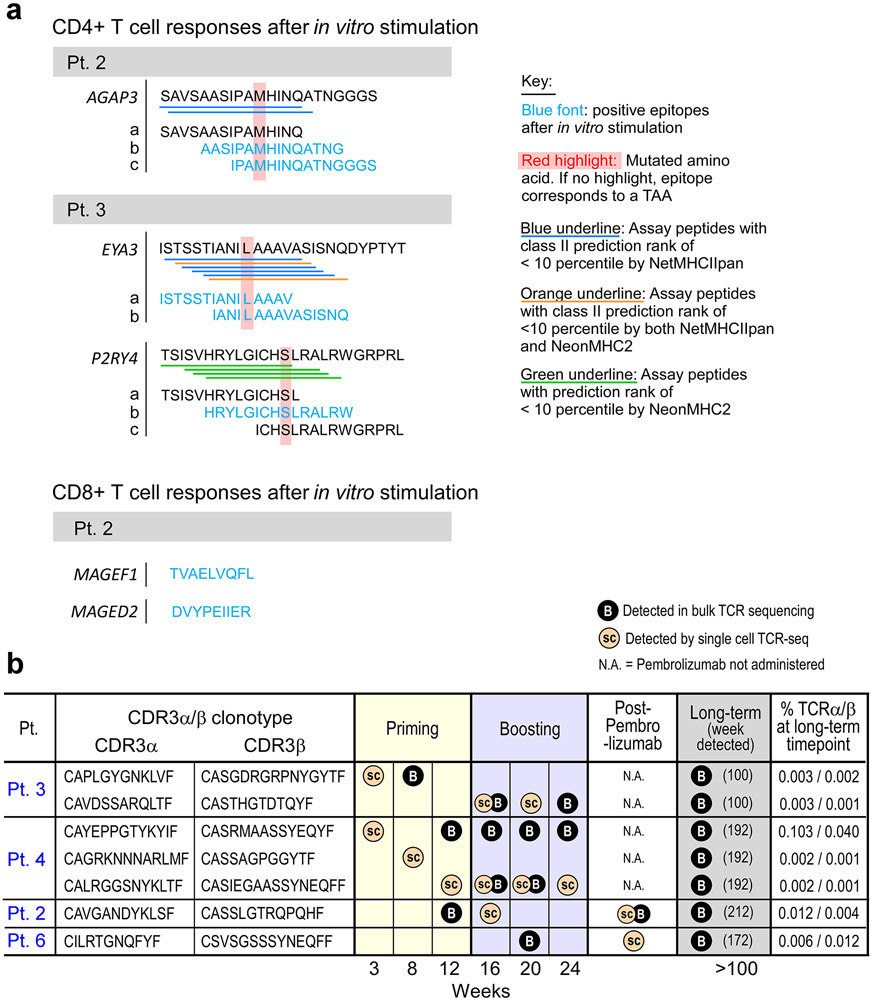
Extended Data Figure 9. Mapping of individual ASP and EPT directed CD4+ and CD8+ T cell responses to the non-vaccine IMP and TAAs, and tracking of unique TCR clonotypes identified through single-cell and bulk TCR sequencing during and after vaccination.
a. ASP and EPT covering the non-vaccine IMP that induced T cell responses. Blue font: peptides that generated a T cell response after one round of pre-stimulation with peptides. Red highlight: mutated amino acids. EPT covering the TAA are shown for the TAA that induced T cell responses. Blue underline: assay peptides with class II prediction rank of < 10th percentile by NetMHCIIpan38. Green underline: assay peptides with prediction rank of < 10th percentile by NeonMHC239. Orange underline: assay peptides with class II prediction rank of <10th percentile by both NetMHCIIpan and NeonMHC2. (Supplementary Datasets 11, 12). b. TCRαβ clonotypes for Pts. 2-6 originally identified through single-cell TCR sequencing that were identifiable at the long-term time points by bulk TCR sequencing are shown. Beige circles indicate time points of detection by single-cell TCR sequencing. Black circles indicate timepoints of detection by bulk TCR sequencing.

