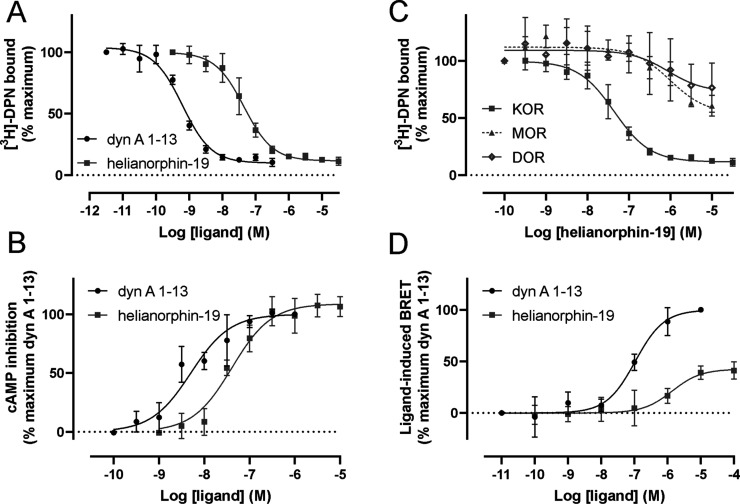
Figure 3.
(A) Concentration-dependent competition binding curves of helianorphin-19 (n = 3) and dynorphin A (dyn A) 1–13 as a positive control (n = 3) using 1 nM [3H]-diprenorphine (DPN) and mouse KOR containing membrane preparations. The difference between total binding and nonspecific binding is defined as specific binding. Data are mean ± SD. (B) KOR activation induced by helianorphin-19 (n = 3) and the positive control dyn A 1–13 (n = 3) was measured in a concentration-dependent manner by quantifying cAMP in HEK293 cells stably expressing the mouse KOR. (C) Selectivity profile of helianorphin-19 was determined in radioligand displacement studies on HEK293 cell membranes stably expressing the mouse μ-opioid receptor (MOR) and δ-opioid receptor (DOR) (n = 2). Binding of helianorphin-19 on mouse KOR cells is included for comparison. (D) β-arrestin-2 recruitment assay of helianorphin-19 and dyn A 1–13 was conducted in HEK293 cells transiently expressing mouse KOR-EGFP and β-arrestin-2-nano-luciferase and using furimazine as an enzyme substrate. Data are mean ± SD and are normalized to the percentage of maximum recruitement of dyn A 1–13 (n = 5). The EC50 values for helianorphin-19 and dyn A 1–13 were 1.4 ± 0.3 μM and 116 ± 39 nM, respectively. The Emax value for helianorphin-19 was 41.1 ± 3.7%. EGFP—enhanced green fluorescence protein. BRET—bioluminescence resonance energy transfer.

