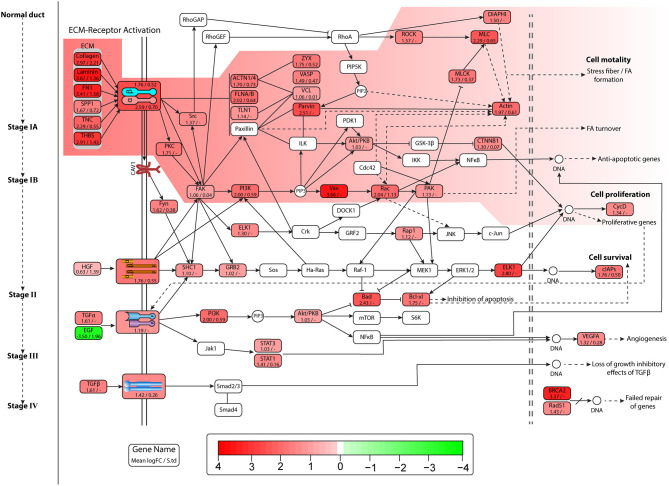
Figure 4.
Figure represents expression of genes, and each entity contains name of gene mean Log2FC value and standard deviation of Log2FC values in all datasets. Pathway image is similar to Figure 3 depicting pancreatic cancer (PaCa) progression signaling in cell. Entities in the highlighted path show high overexpression, and lead to lamellipodia formation and initiation of proliferative gene expression.

