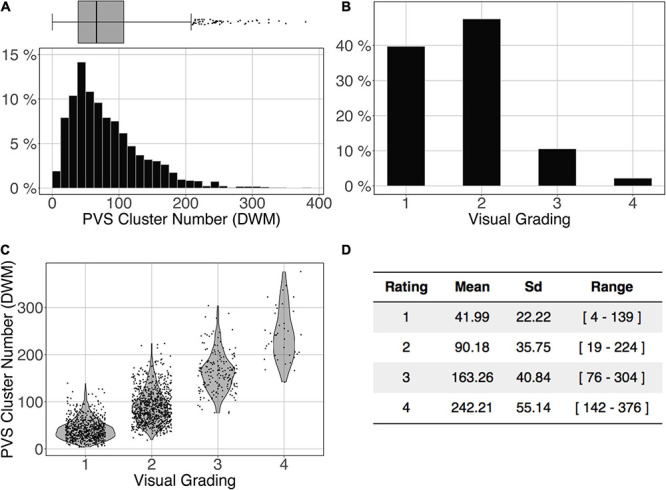
FIGURE 10.

Cluster analysis of the deep white matter (DWM) PVS of the ENCOD set (N = 1,782). The prediction maps were thresholded at 0.5. (A) Histogram distribution of the number of clusters per subject. (B) visual grading. (C) Number of clusters vs. visual grading (R20.5 = 0.45, p-Value < 10– 4). (D) Summary of PVS load values within the 4 groups.
