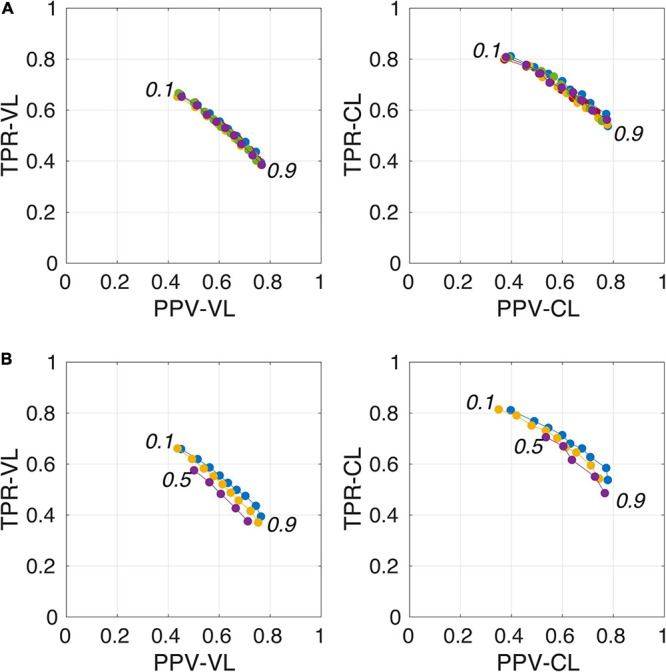
FIGURE 4.

Plot of true positive rates (TPRs) vs. positive predictive values (PPVs) for the 9-amplitude prediction map thresholds (PredMap-Thrs, 0.1 to 0.9 in step sizes of 0.1) computed for replication analysis based on 40 TRAIN subjects (each of the 5 replications is shown with a different color) (A) and for training the model with 20 (purple), 30 (yellow), and 40 (blue) subjects (B) using voxel level (VL) (left) and cluster level (CL) (right).
