
FIGURE 7.
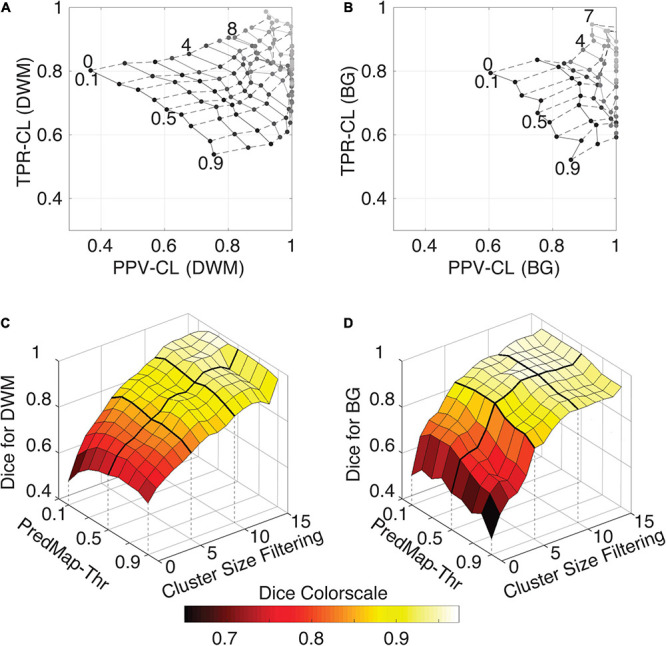
(A) Cluster-level true positive rate (TPR-CL) vs. the positive predictive value (PPV-CL) of PVS detection in deep white matter (DWM) for the EVAL dataset (N = 10). Metric values are shown with masking clusters with increasing size (dashed lines, 0 to 15 voxels) and 9 amplitude prediction map thresholds (PredMap-Thrs, solid lines, 0.1 to 0.9 in steps of 0.1). (B) Same for detection of basal ganglia (BG) PVS, increasing the cluster size threshold from 0 to 7 voxels. (C) Dice scores of PVS detection in deep white matter for the EVAL dataset (N = 10) at the 9 PredMap-Thr and masking clusters with increasing size (0 to 15 voxels). (D) Same as C but for basal ganglia PVS detection.