
FIGURE 8.
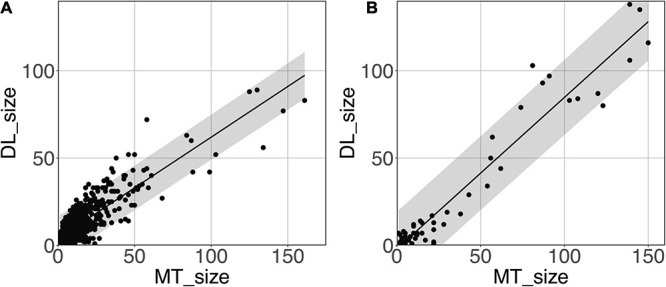
Predicted cluster size (DL_size) vs. the manual tracing size (MT_size) for deep white matter (A) and the basal ganglia (B). Both were computed with the amplitude prediction map threshold (PredMap-Thr) of 0.5. Black line: linear regression curve; shaded area: 95% confidence interval of individual values.