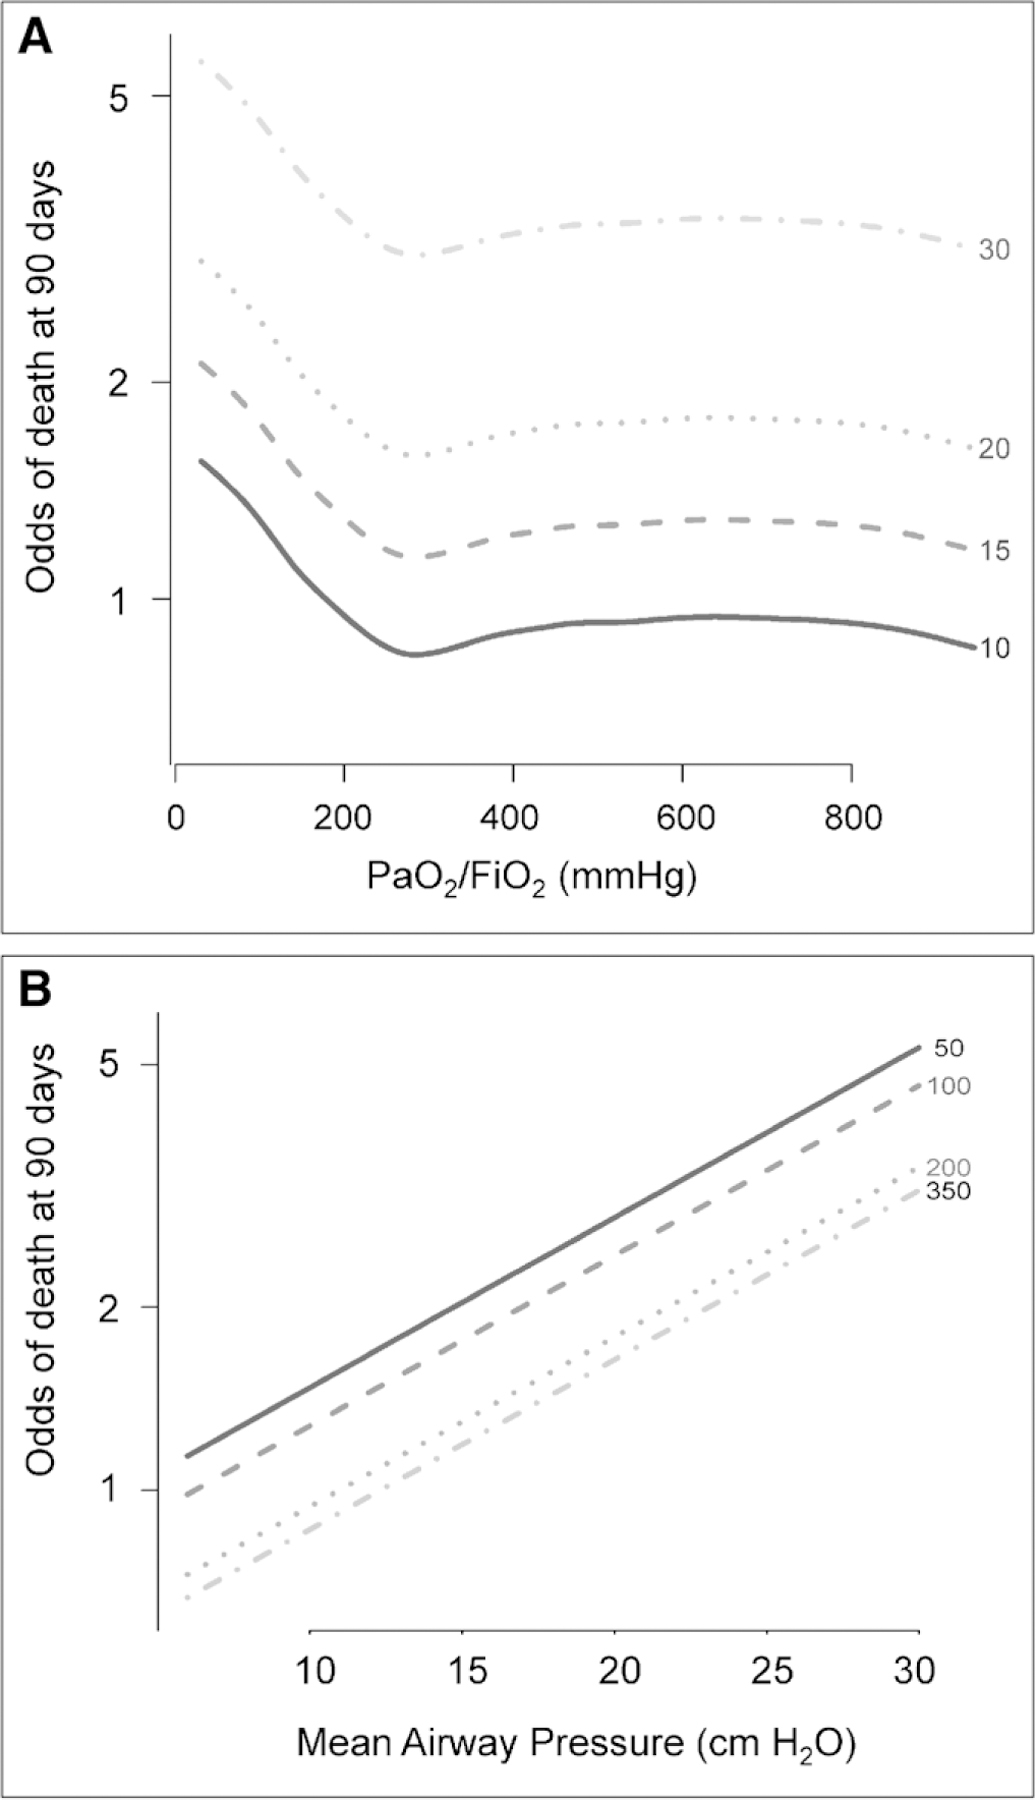
Figure 4.

Adjusted odds of mortality as a function of Pao2/Fio2 and mean airway pressure (Pmean) (B). At higher Pmean and at lower Pao2/Fio2, the odds of mortality are independently higher. A, In adjusted analysis, the relationship between Pao2/Fio2 and mortality is nonlinear. Nevertheless, lower Pao2/Fio2 is independently associated with mortality over a range of Pmean with an inflection near 300 mm Hg. B, In adjusted analysis, the relationship between Pmean and mortality is linear at any value of Pao2/Fio2 (i.e., 50, 100, 200, 350 mm Hg).
