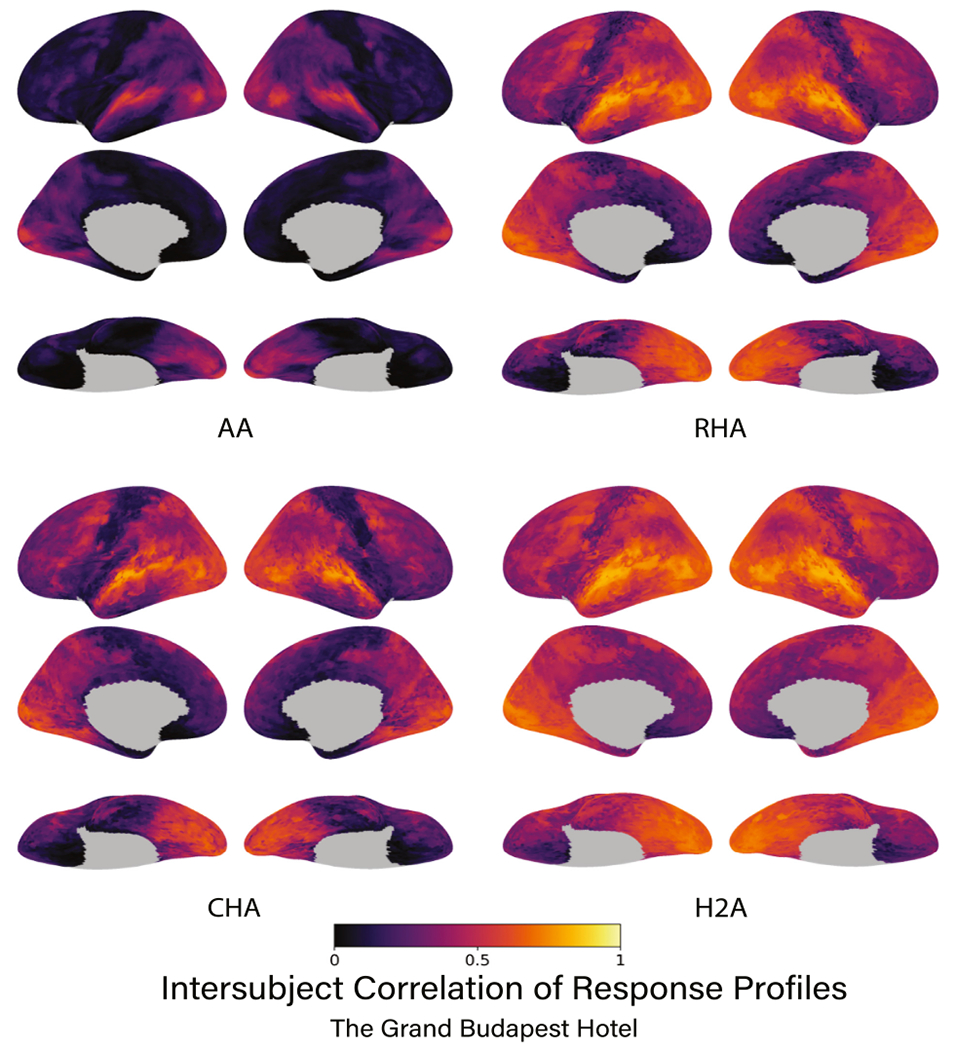
Fig. 2.

The intersubject correlation of response profiles using the Budapest data for each type of alignment algorithm. Correlations are presented for each vertex on the cortical surface averaged over data folds and participants. Subsequent figures show only left lateral hemisphere views of results. Brain image figures of results for all three datasets with lateral, medial, and ventral views are shown in Supplemental Figs. S1,S2.
