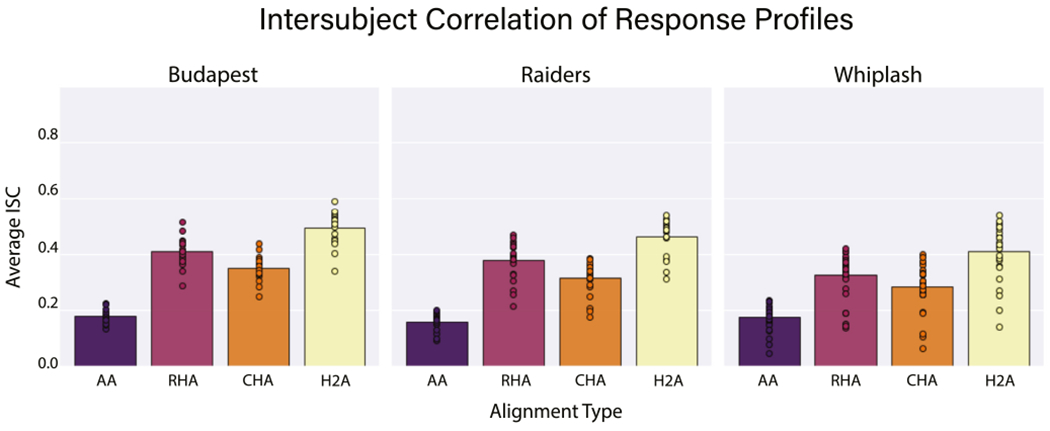
Fig. 3.

The average intersubject correlation of response profiles is shown for each alignment algorithm for each data set. Bars represent the average intersubject correlation over all vertices, data folds, and participants. Circles represent the average intersubject correlation for an individual participant over all vertices and data folds.
