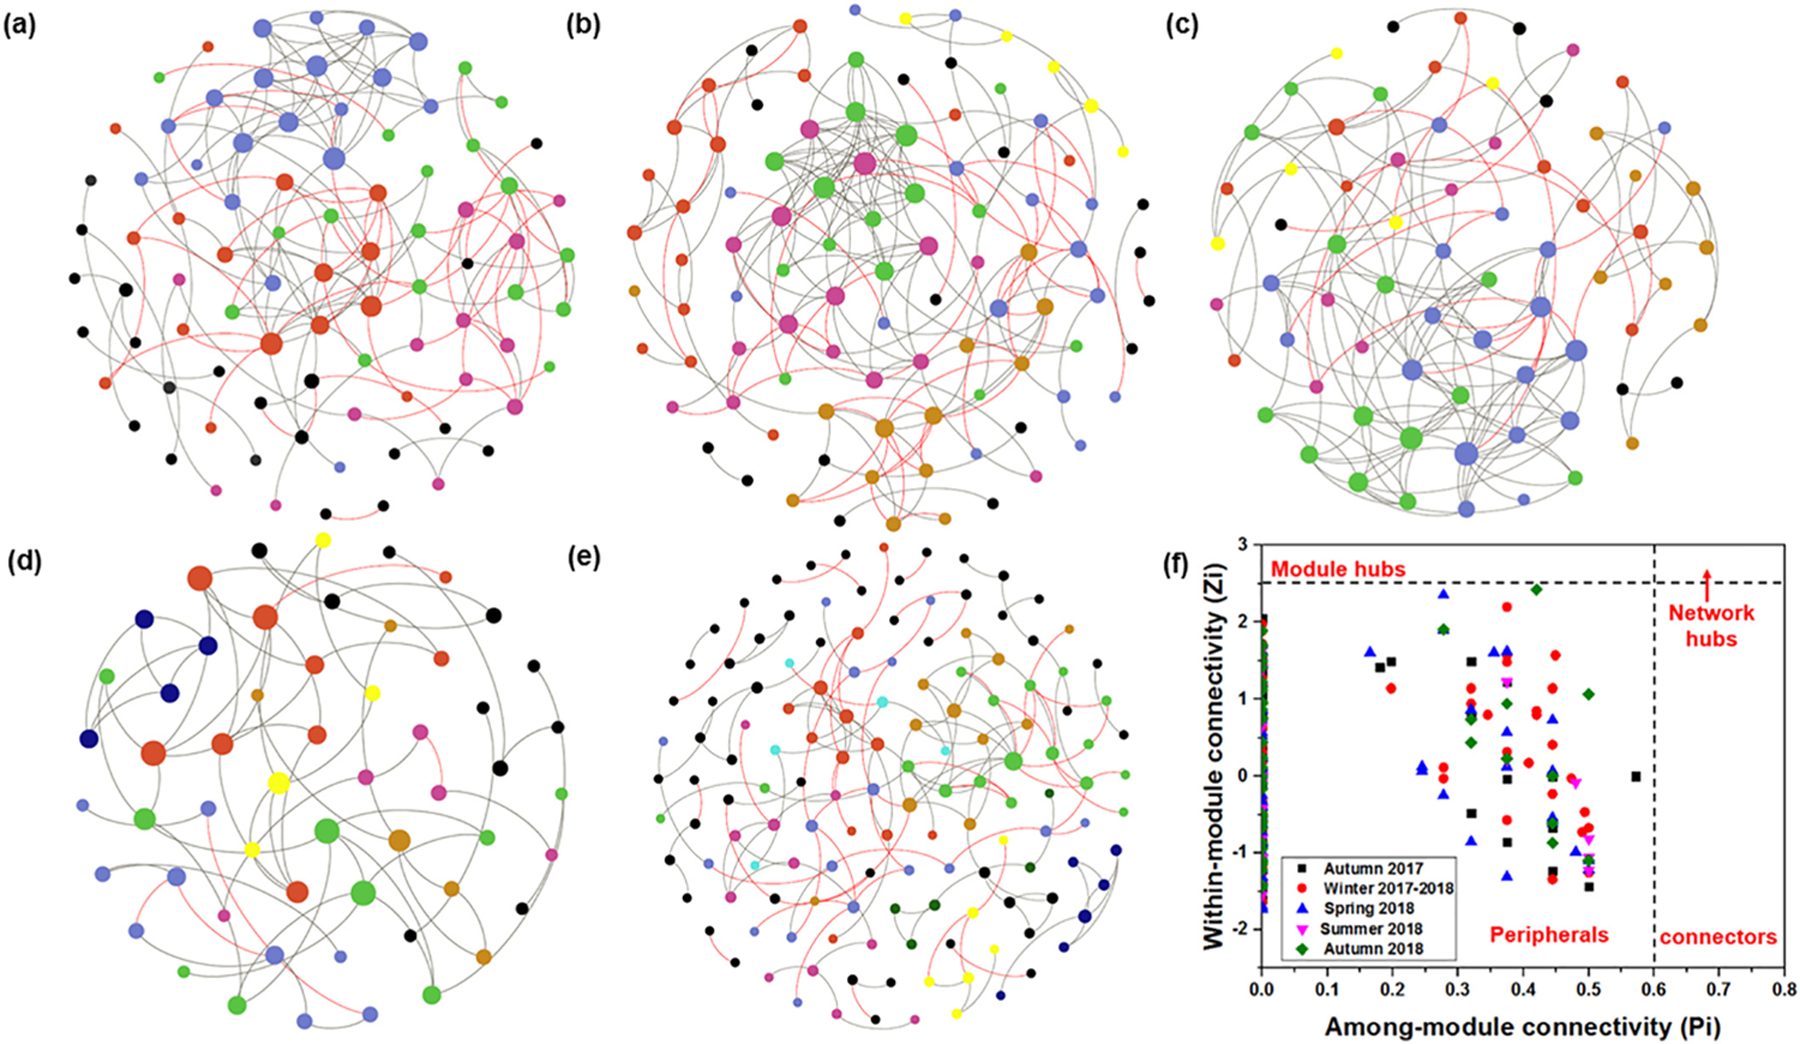
Fig. 3.

Networks in BAC filters in different seasons. (a–e) Visualization of co-occurrence networks for autumn 2017, winter 2017–2018, spring 2018, summer 2018, and autumn 2018. Nodes represent ASVs, and links between nodes indicate significant correlations. Positive links between nodes are colored grey and negative links are colored red. Modules are randomly colored at each season, and nodes in modules with less than five nodes are colored black. (f) Z-P plot based on the topological roles of each node in different seasons. (For interpretation of the references to color in this figure legend, the reader is referred to the web version of this article.)
