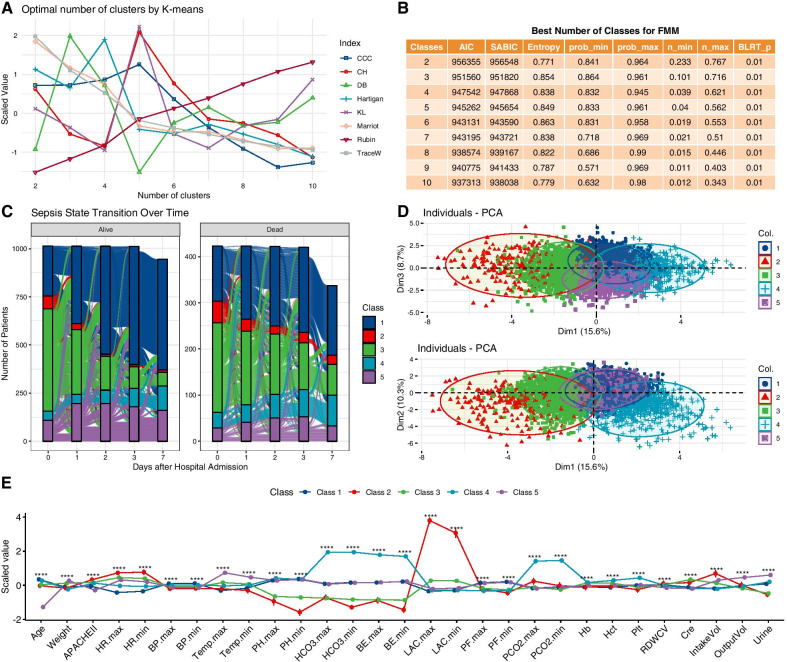
Fig. 2.
Classes of septic shock. A Optimal number of clusters by K-means clustering. The statistics were scaled for better visualization. Statistics such as CCC, CH and KL showed the highest value for five clusters; lower value of DB indicates better fit which also supports the existence of five clusters. Some statistics utilize elbow point to identify the best number of clusters such as Hartigan, Marriot and TraceW. These statistics consistently indicated an elbow joint at 5-class. B Metrics for choosing the best number of classes for FMM. C Class membership transition over days 0, 1, 2, 3 and 7. It is noted that most patients in class 2 (critical class) on day 0 would transition to other classes, indicating improvement in these critical cases. Patients who transitioned to class 2 were more likely to die. D PCA showing that the five classes can be visually separated by the first three principal components. One point represents one sample (one data point per patient day). E Characteristics of the five classes identified by FMM. All numeric values were scaled (i.e., centered on mean and divided by standard deviation) for better visualization on the vertical axis. Seventeen variables were used for FMM training, but 29 variables are displayed to give a comprehensive clinical characteristics for these classes. Class 1 is the largest class over all study days with all variables in average value (the baseline class). Class 2 is characterized by poor tissue perfusion and multiple organ failure and can be called the critical class. Class 3 is characterized by highest serum creatinine and metabolic acidosis and can be called renal dysfunction class. Class 4 is characterized by the highest PaCO2 (60; IQR 50–77 mmHg) and low PF ratio (169; IQR 118–232 mmHg) and can be designated as respiratory failure class. Class 5 is characterized by young age, low mortality and well-preserved renal function and can be considered as the mild class. FMM finite mixture modeling, CCC cubic clustering criterion, CH Calinski and Harabasz index, DB Davies and Bouldin index, KL Krzanowski and Lai index. ****< 0.001

