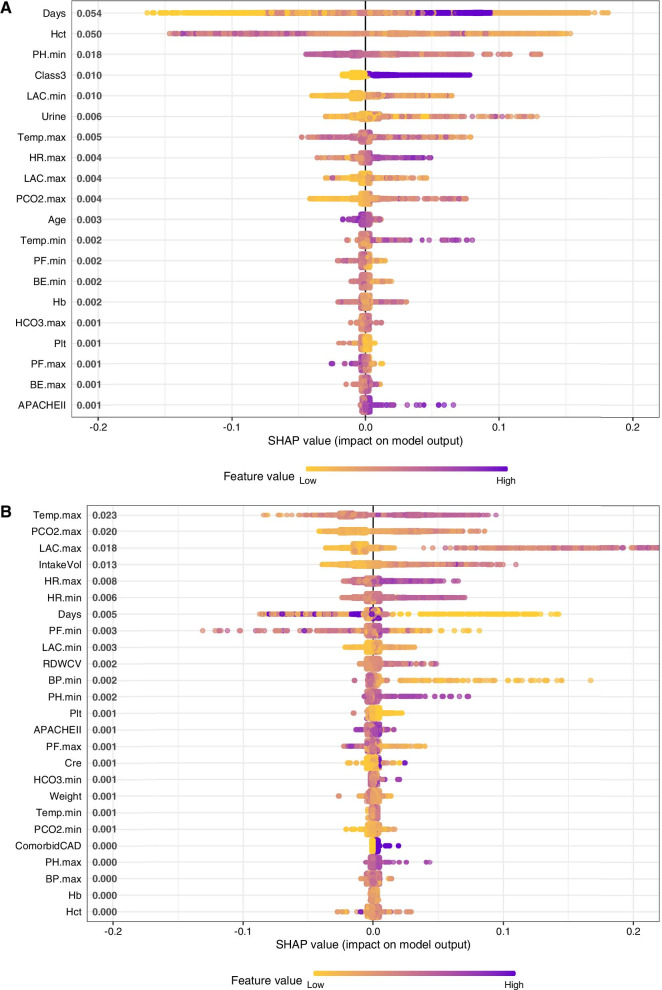
Fig. 5.
Risk factors for fluid and epinephrine overdosing explored using XGboost. Gradient color indicates the original value for that variable. Each point represents a row from the original dataset. A SHAP values of individual features in predicting the risk of fluid overloading (top 20 features are shown in the figure). ICU day was the most important variable predicting fluid overload. Patients in class 3 were more likely to receive fluid overload (the purple color indicates class 3 patients, and they contribute to increased risk of fluid overload as represented by the positive value on x-axis). B SHAP values of individual features in predicting the risk of norepinephrine overdosing (top 20 features are shown in the figure). Higher heart rate (purple color) was found to be associated with increased risk (positive SHAP value on x-axis) of norepinephrine overdosing

