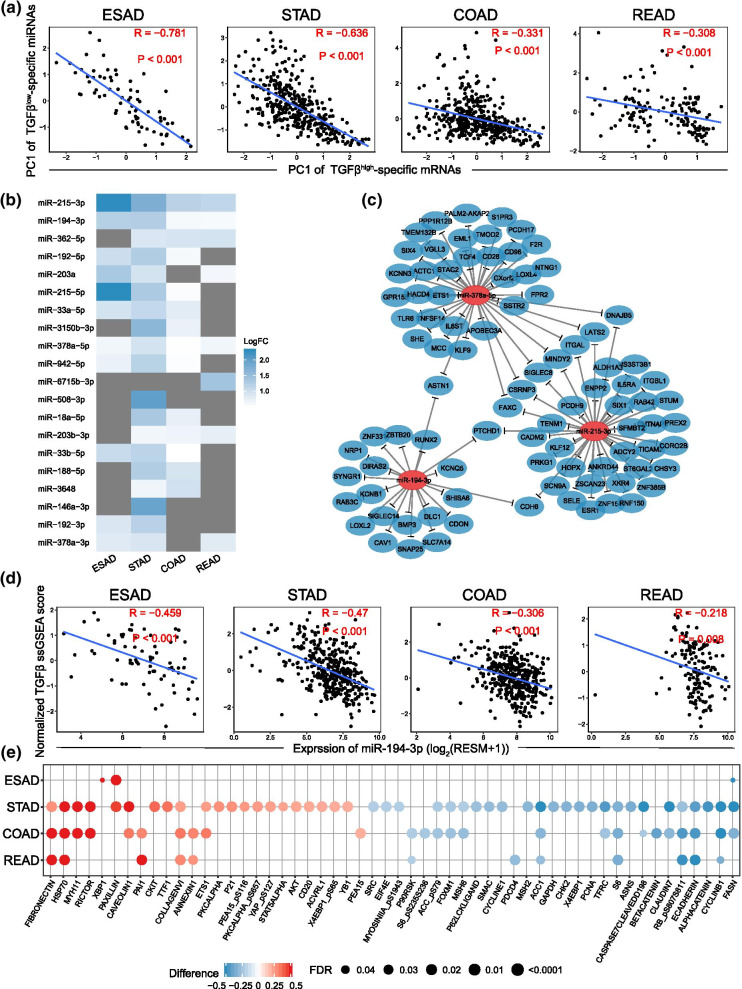
Fig. 4.
Comparison of miRNA, and protein expression in different TGF-β status. a Correlation between the first principal component (PC1) of the expression of TGF-βlow-specific miRNAs and their predicted targeted TGF-βhigh-specific mRNAs. b The heatmap shows the most significantly down-regulated 20 miRNAs in the TGF-βhigh group across each GIAD. c A network Schematic diagram of miR-215-3p, miR-378a-5p, and miR-194-3p and their predicted targeting TGF-βhigh-specific mRNA in stomach adenocarcinoma. d Negative correlation between miR-194-3p expression and TGF-β score in 4 types of GIAD (Pearson correlation). e The significantly differential proteins in TGF-βhigh and TGF-βlow groups; Red indicates high protein expression in the TGF-βhigh group, and blue indicates high protein expression in the TGF-βlow group

