
FIGURE 8.
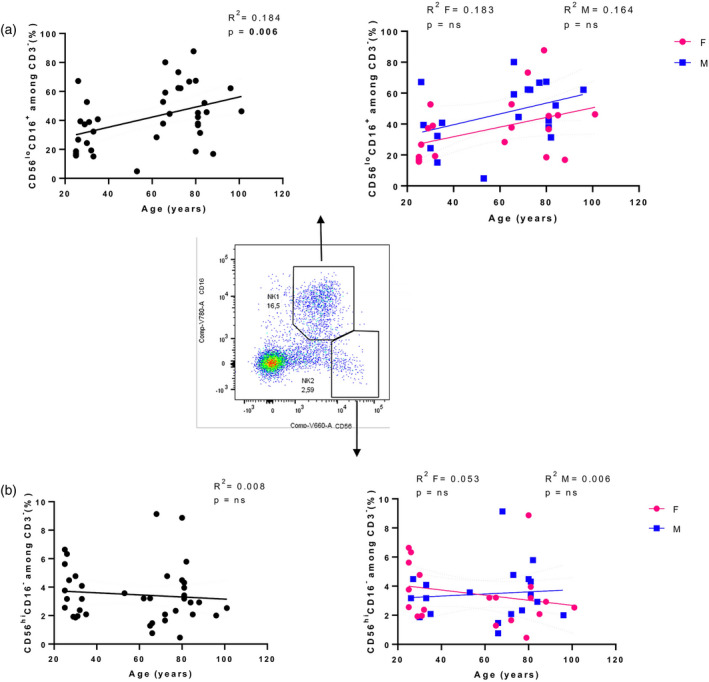
Analysis of natural killer (NK) subsets. Linear regression analysis showing the relationship between cytotoxic (a), secreting cytokines (b) NK cell subsets and age in all individuals (n = 40) (black line), males (n = 18) (blue line) and females (n = 22) (pink line). The coefficient of determination and P‐values are shown on the graphs. Each point represents data from an individual healthy donor. Centre: representative FACS gating of CD56lowCD16+ and CD56highCD16‐ NK cell subsets; R 2 = R squared; n.s. = not significant; F = female; M = male