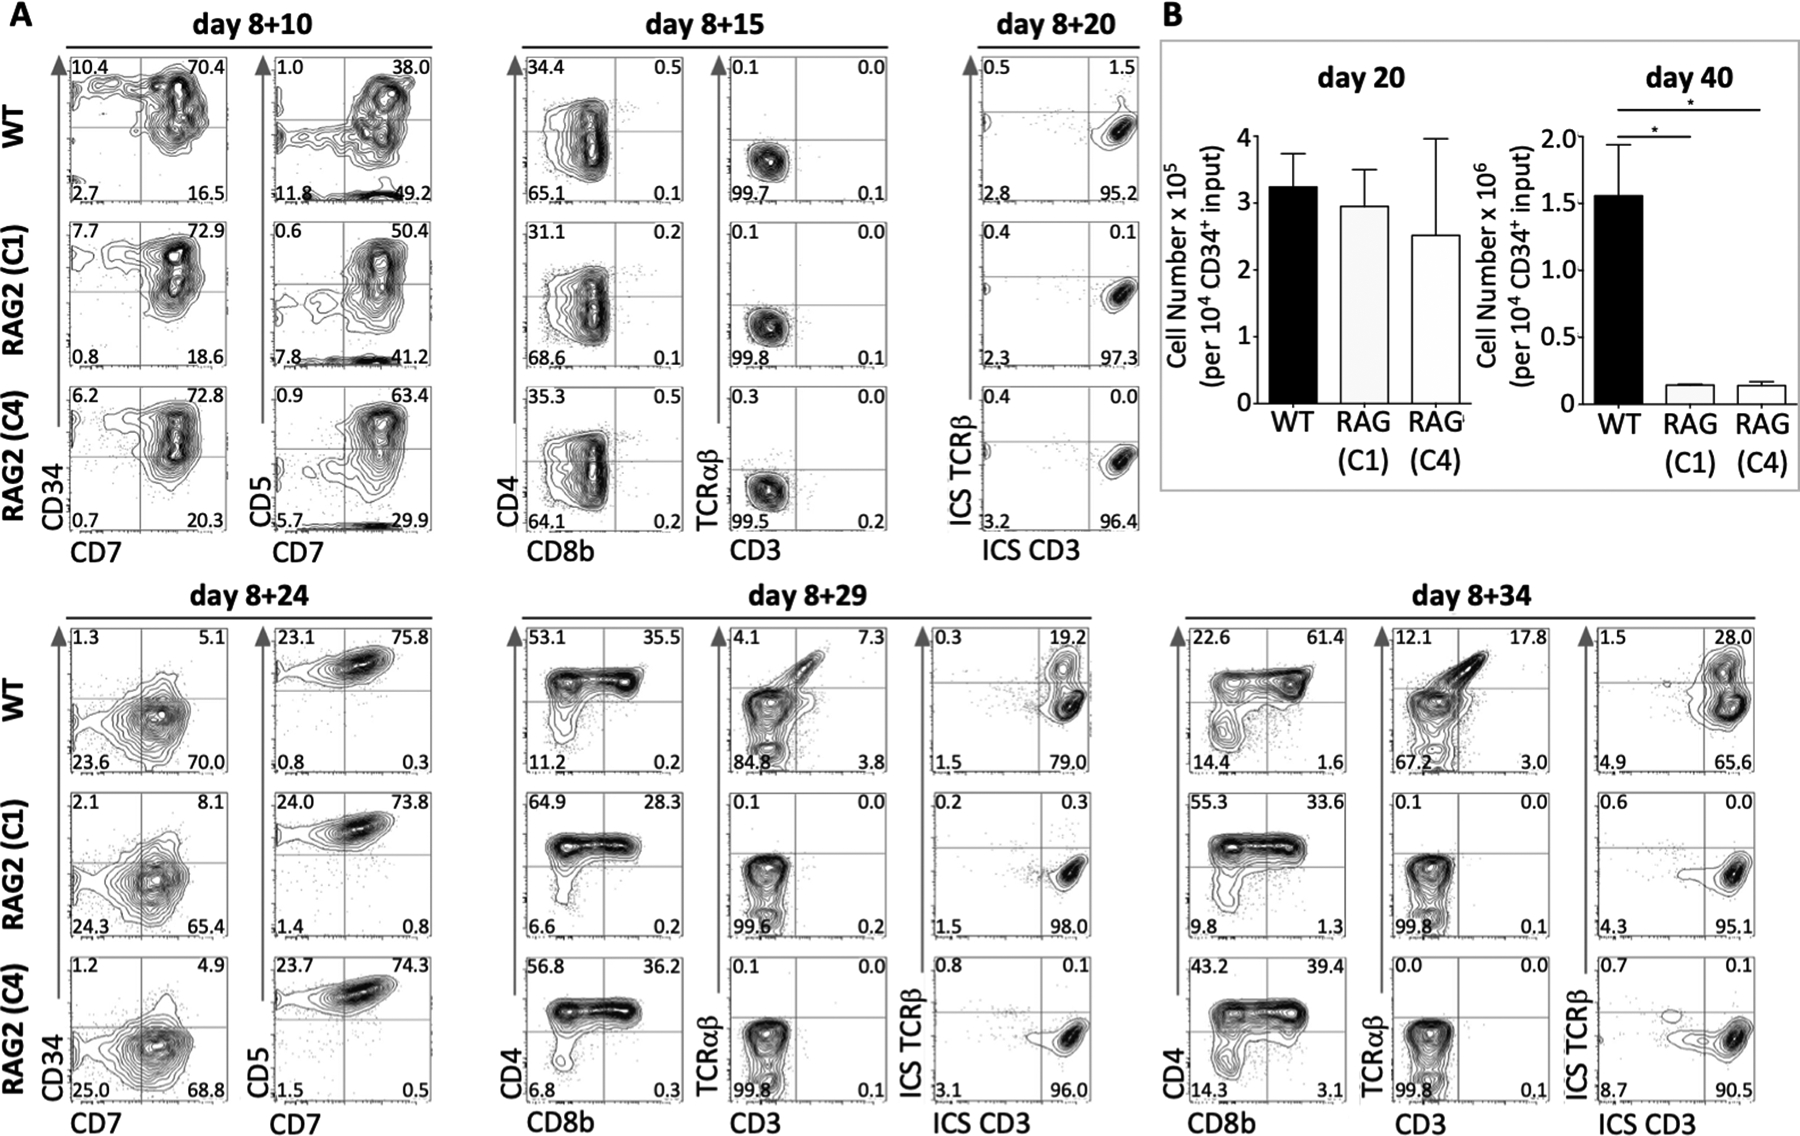
Figure 1. T-cell development from Control WT and RAG2-KO hESC lines.

(A) Representative flow cytometry analysis of Control WT and RAG2-KO (clones 1 and 4) hPSC-derived T-lineage cells from d8 EBs + 10–34d OP9-DL4–7FS co-cultures, as indicated. Cells were pre-gated for DAPI−CD45+. (n=5 of five independent experiments). (B) Cell numbers of Control WT and RAG2-KO (clones 1 and 4) hPSC-derived T-lineage cells per 10,000 input of CD34+ cells after indicated number of days of culture on OP9-DL4–7FS. (n=3 of three independent experiments).
