
Figure 2.
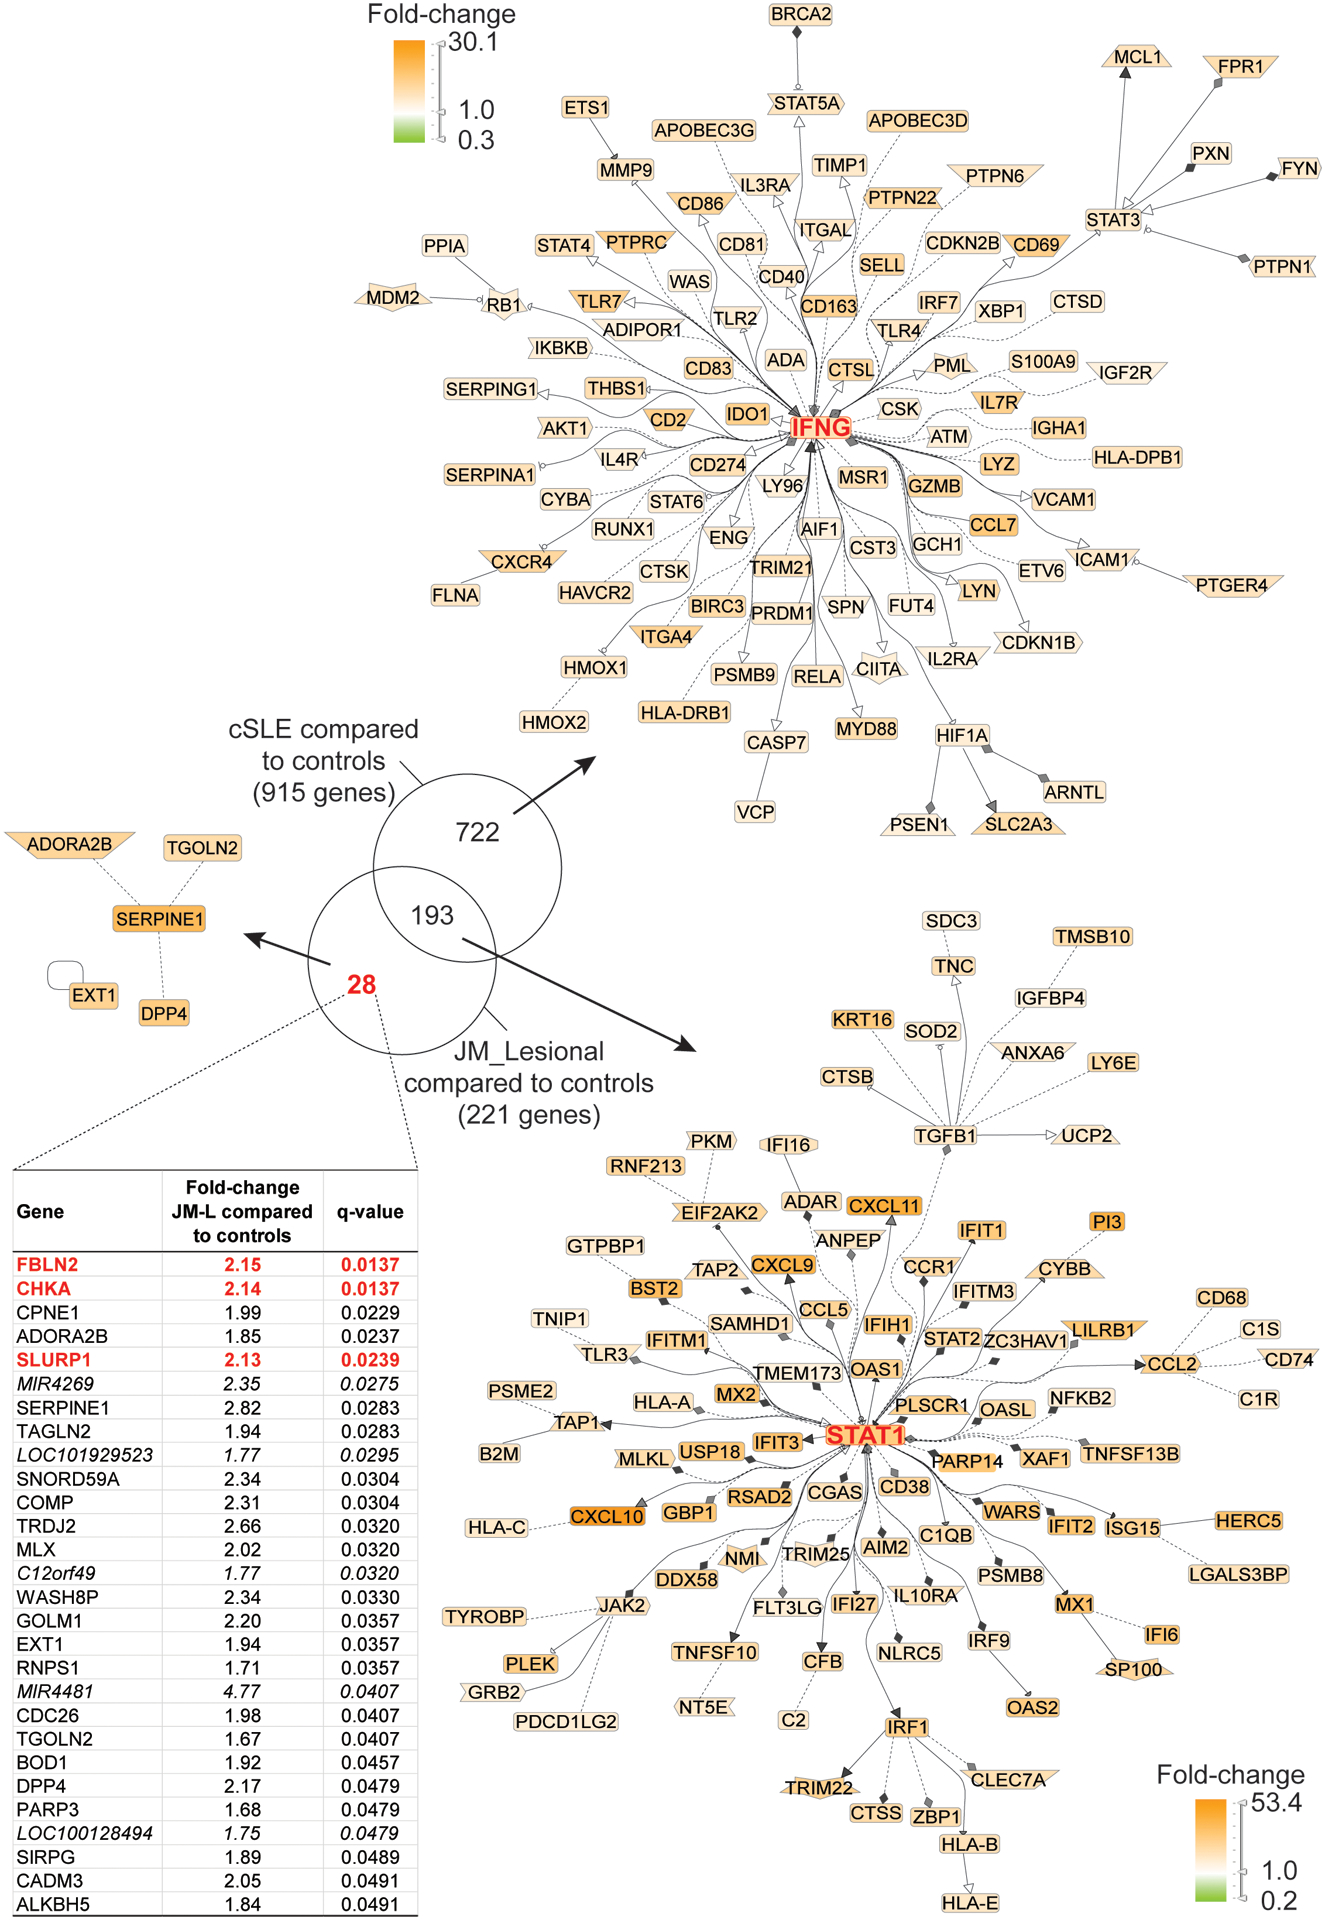
Transcriptomic comparison of cSLE skin with lesional JM skin (q-value<0.05). Literature-based networks (GePS) obtained from the genes regulated in cSLE and JM vs. control biopsies. The pictures display the 100 best connected genes co-cited in PubMed abstracts in the same sentence linked to a function word (most relevant genes/interactions). Orange represents the genes that are upregulated and green represent the genes that are downregulated in lesional compared to control skin.