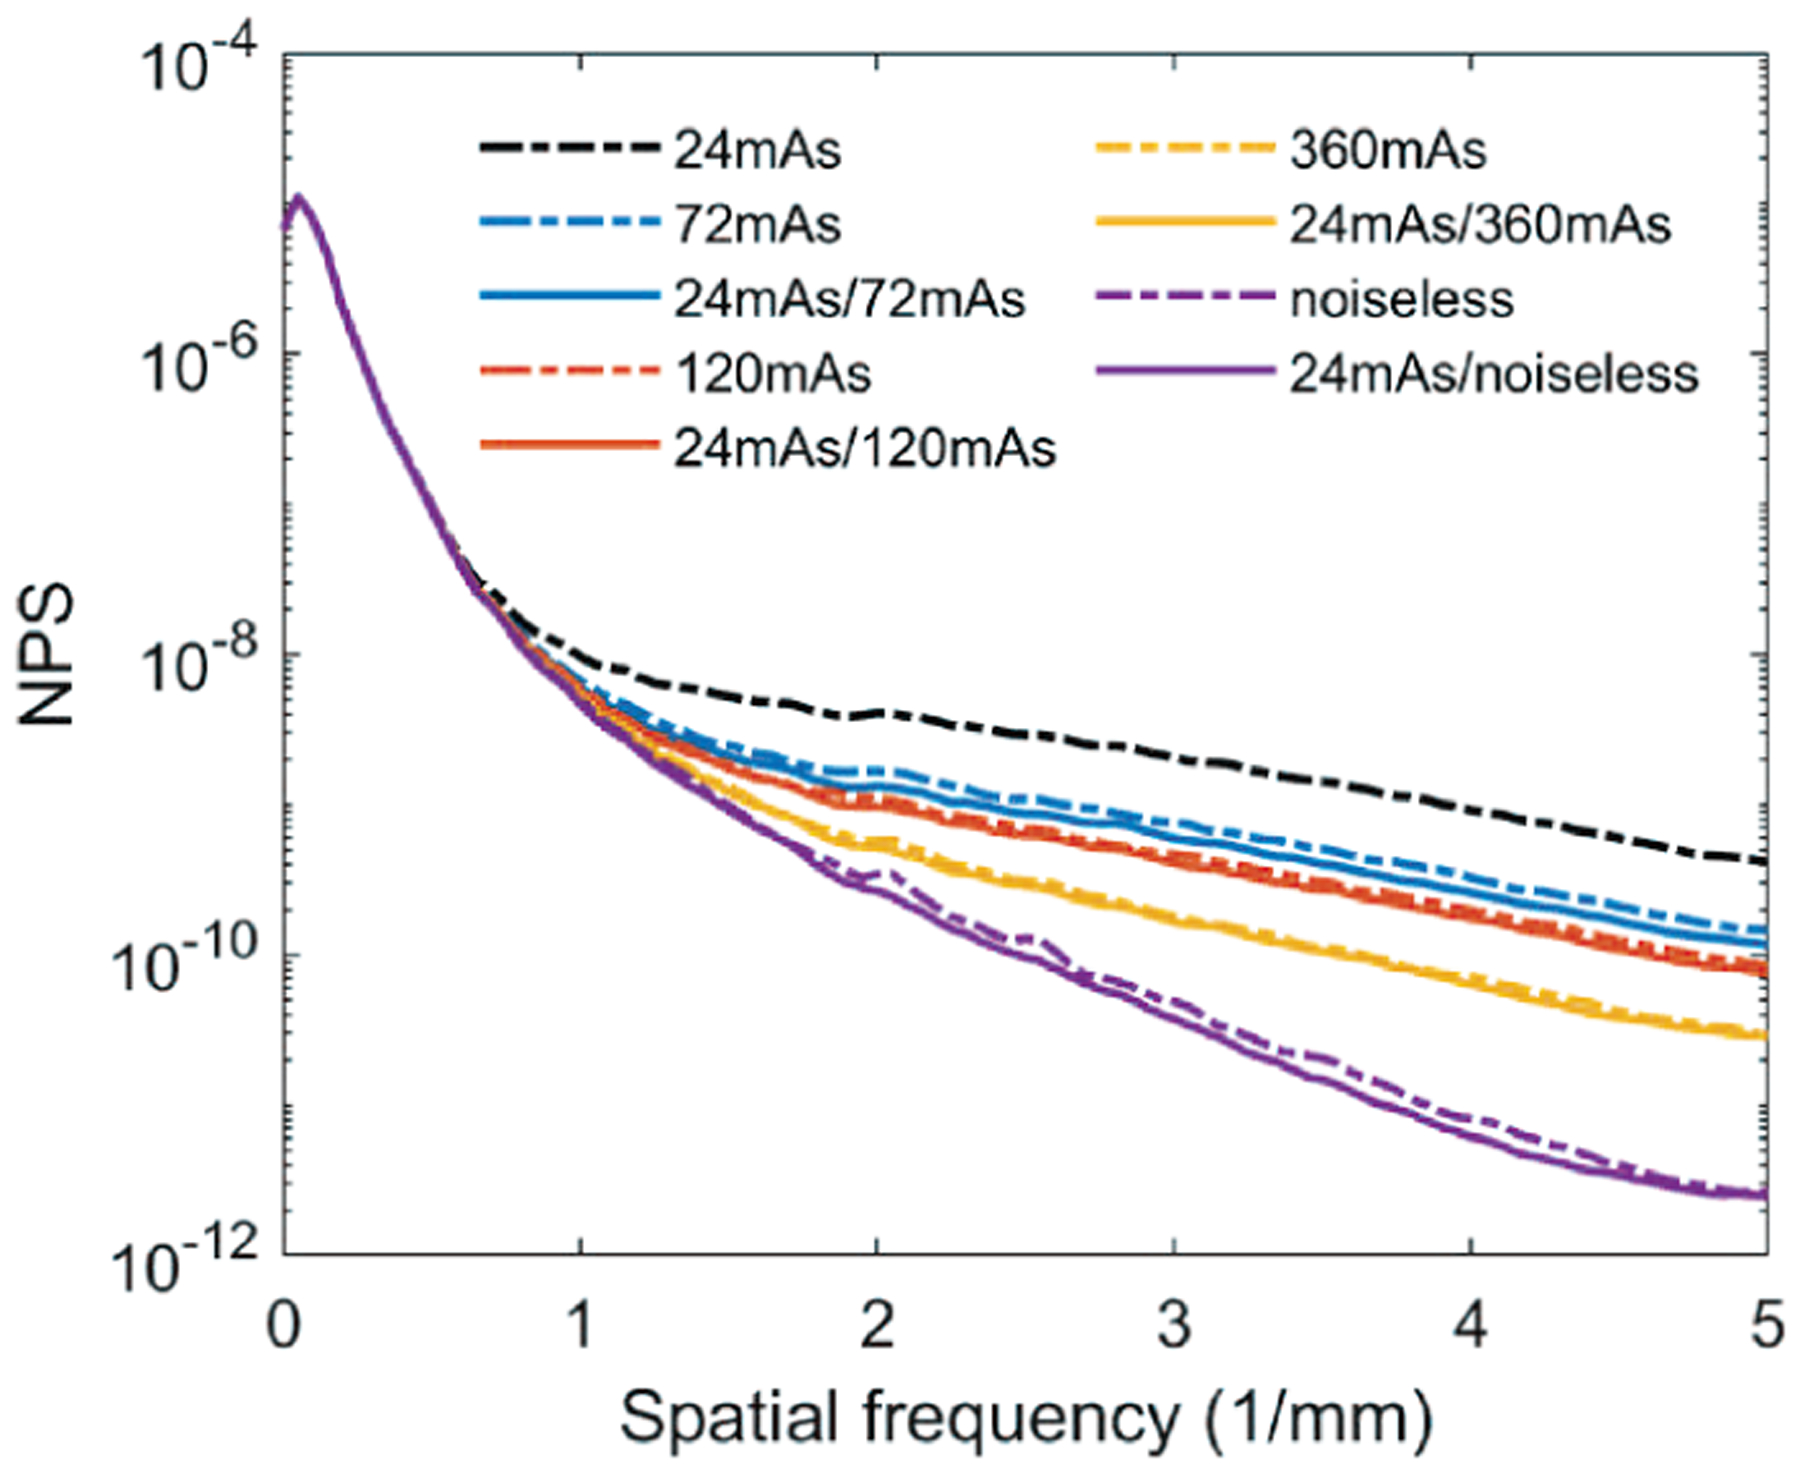
Fig. 4.

The NPS curves of the validation digital phantom volumes for comparing the dose levels of the training targets. The solid lines are calculated from the volumes by deploying the denoisers to the 24mAs volume. The dashed lines are from the CatSim simulated volumes with the corresponding dose levels.
