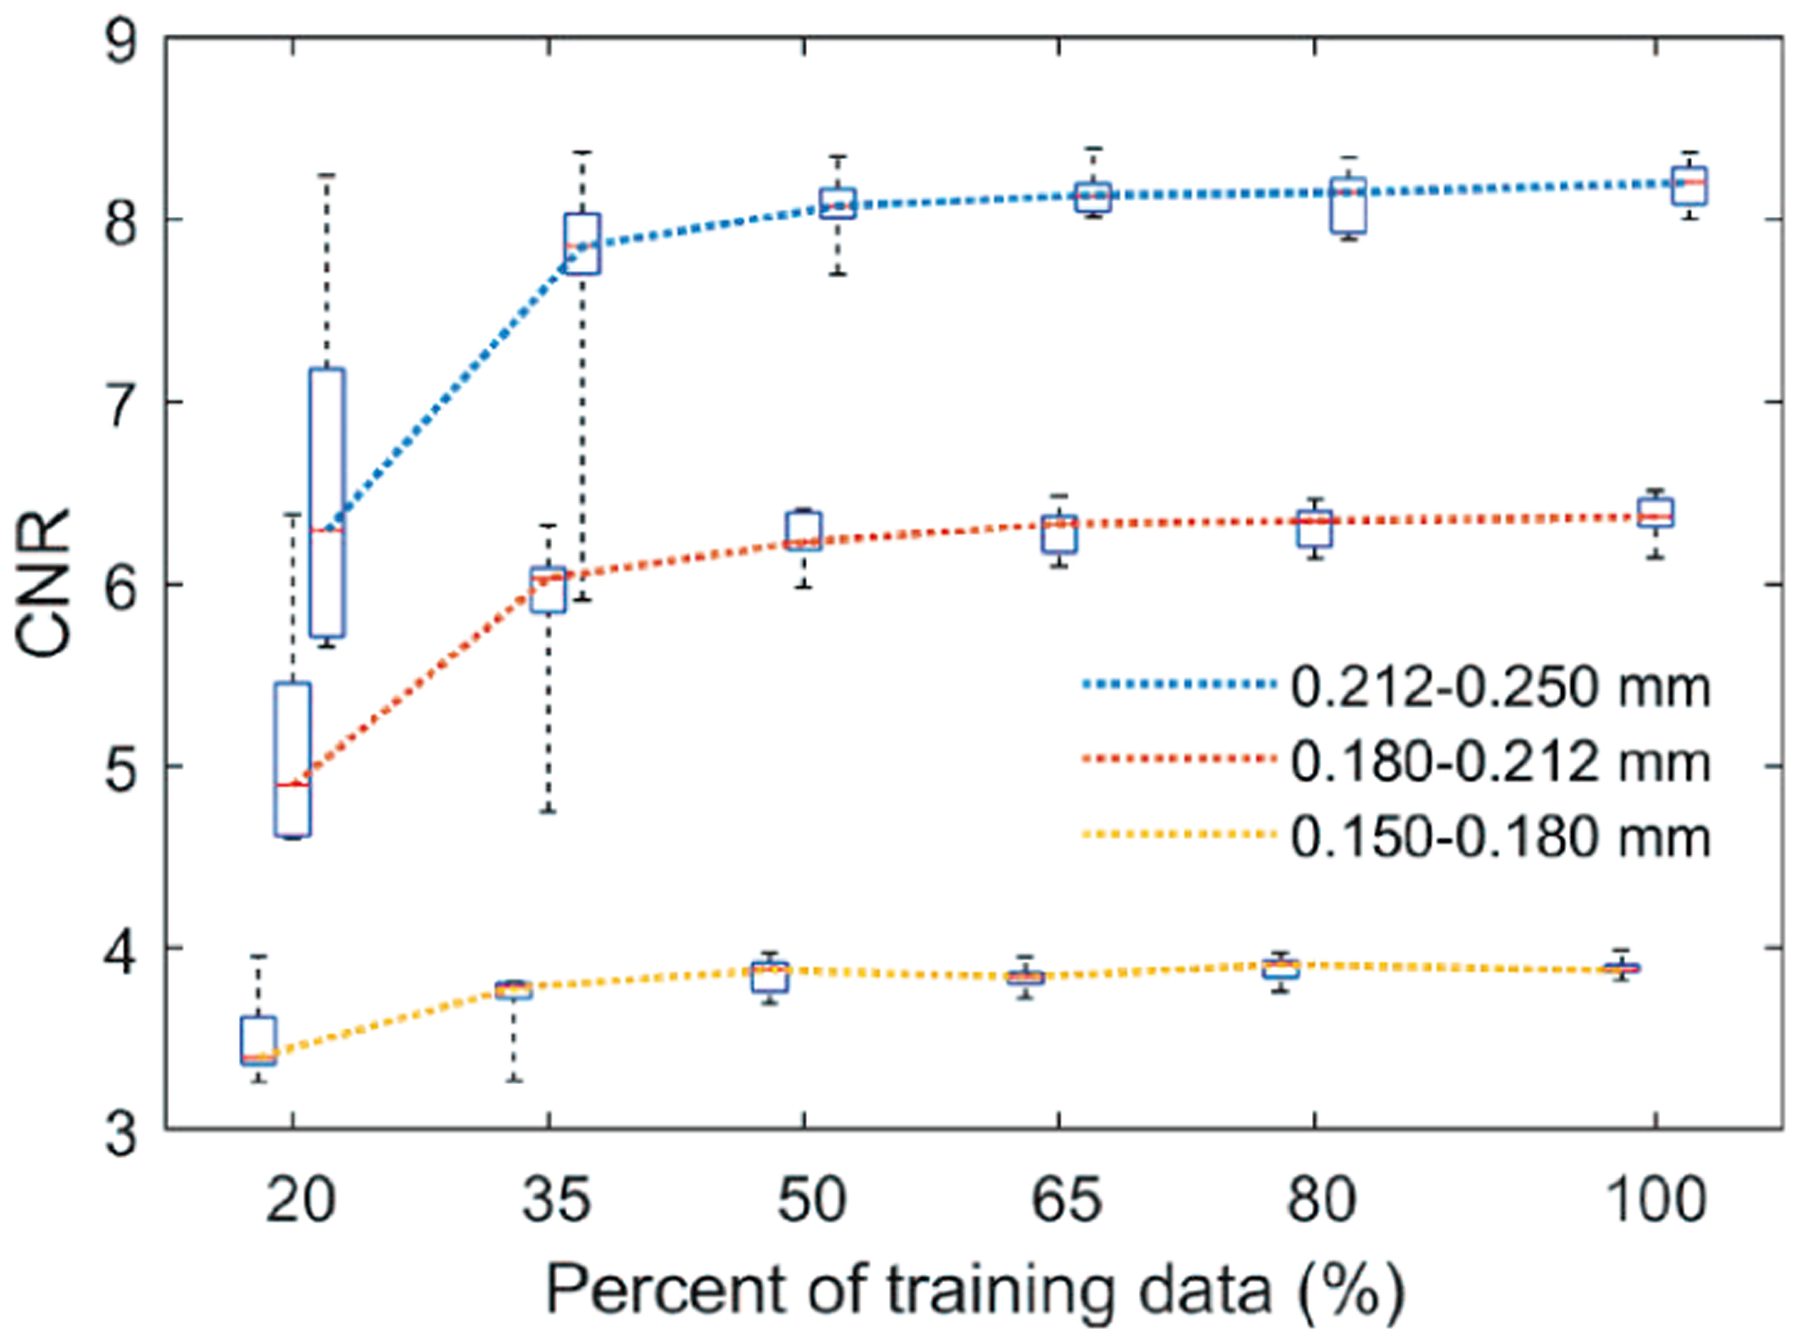
Fig. 9.

The box plots of the CNRs for different training sample sizes. Each box contains 10 data points. In the box plot, the red bar represents the median; the length of the box equals the interquartile range; the whiskers extend to the minimum and maximum data points. The boxes are slightly shifted horizontally to avoid overlap.
