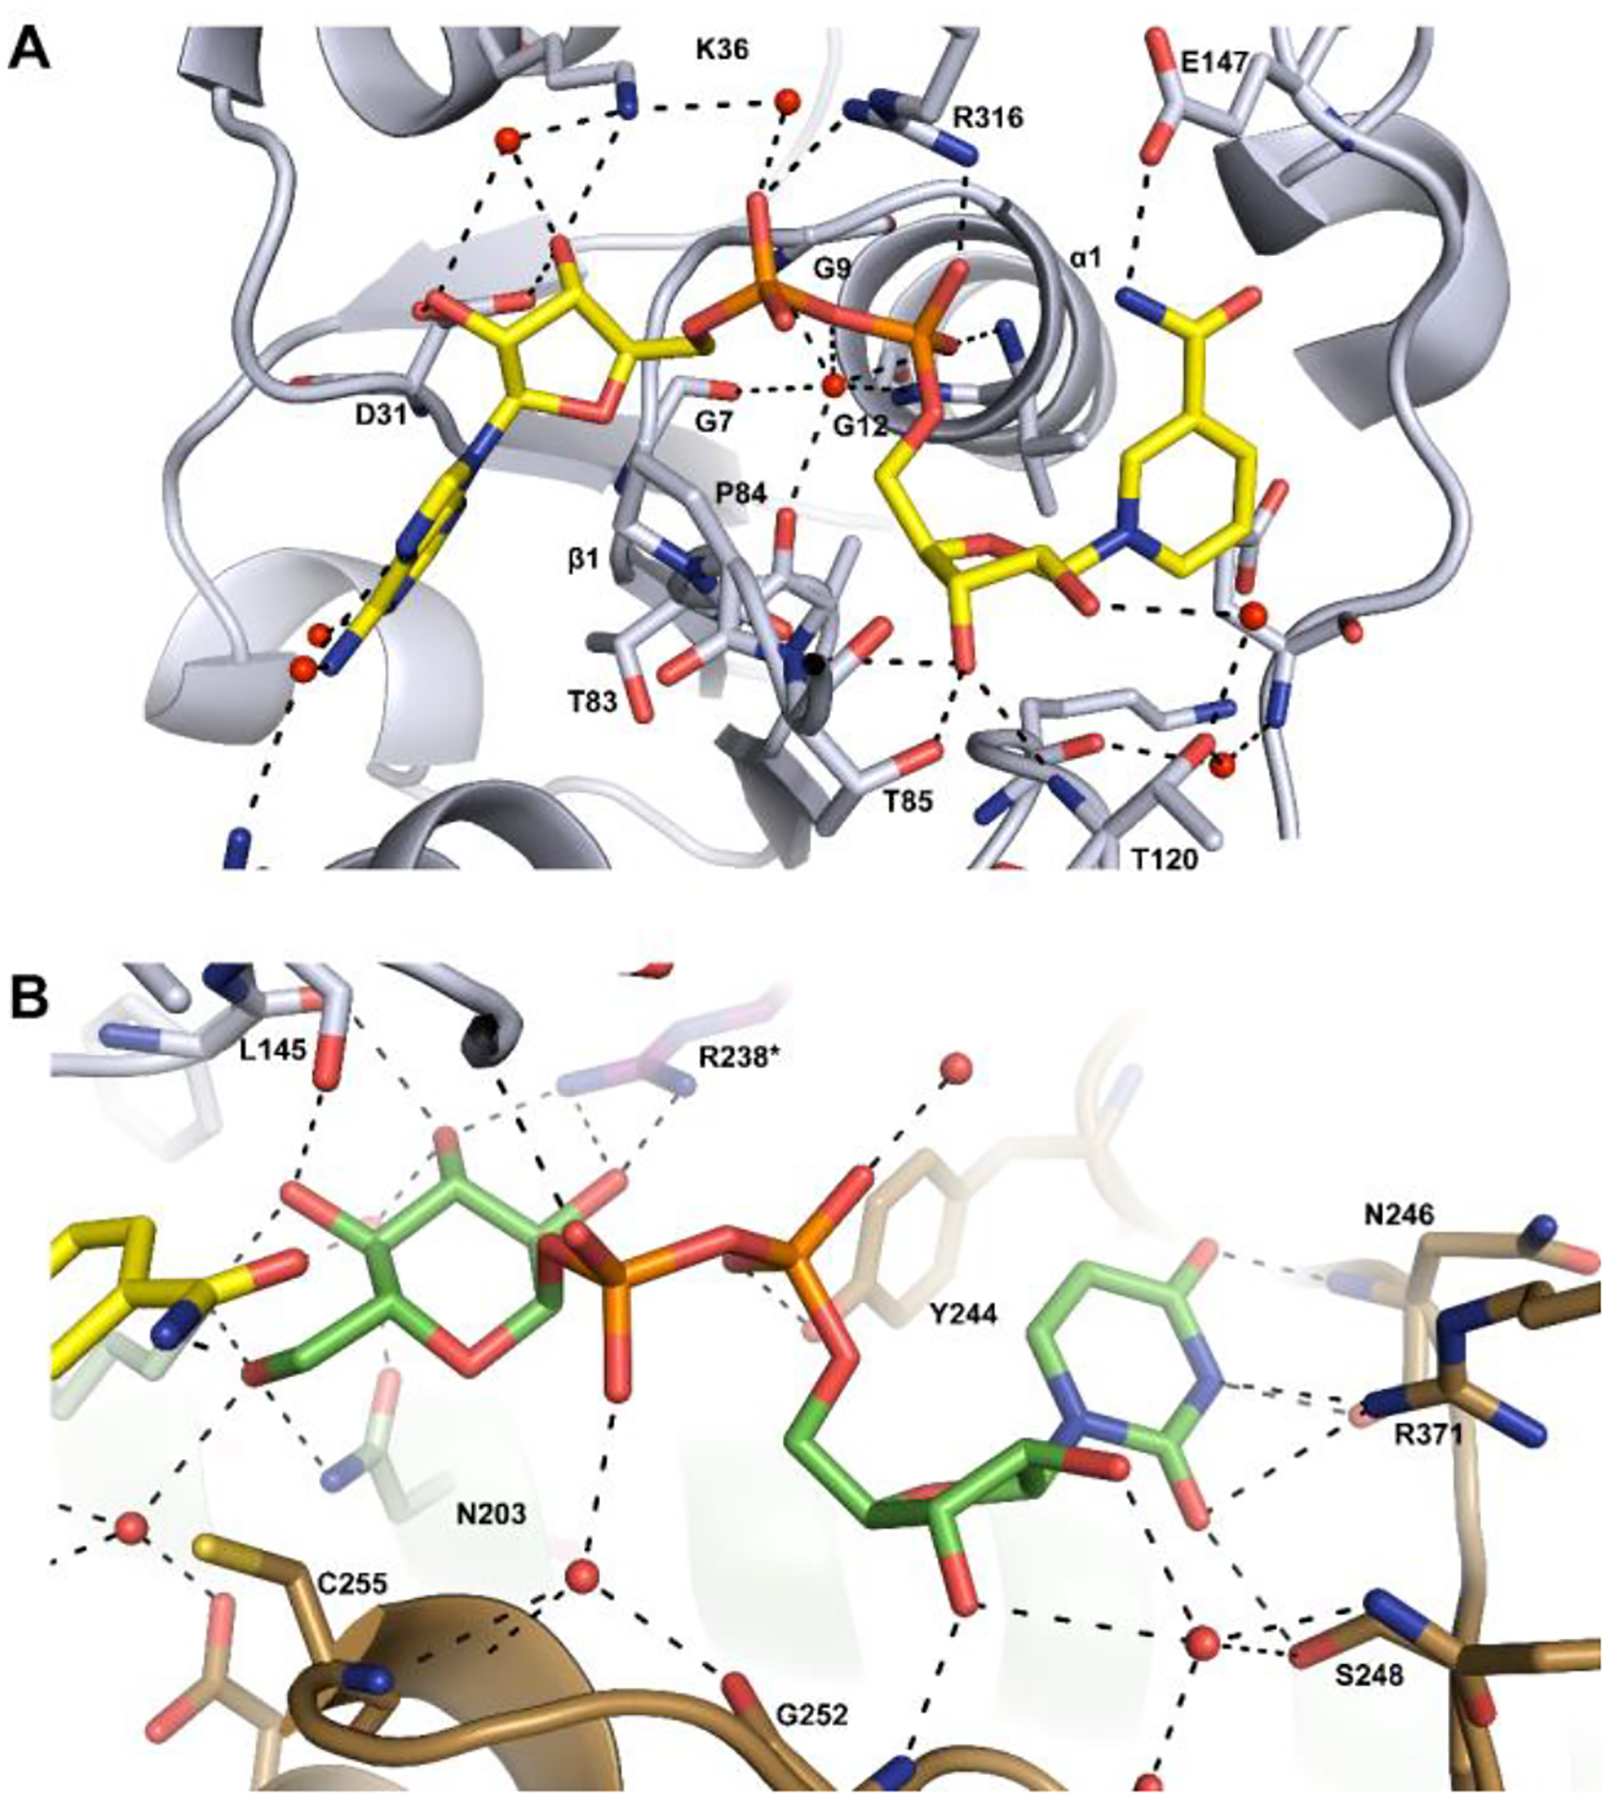
Figure 6.

Cartoon representations of the binding sites for NAD+ and UDP-glucose. Potential hydrogen bonding interactions (<3.2 Å) are shown in black. (A) Binding site for NAD+ (colored yellow) in the N-terminal domain of the protein. (B) Binding site for UDP-glucose (colored green) in the C-terminal domain of the protein. Additional details are provided in the text.
