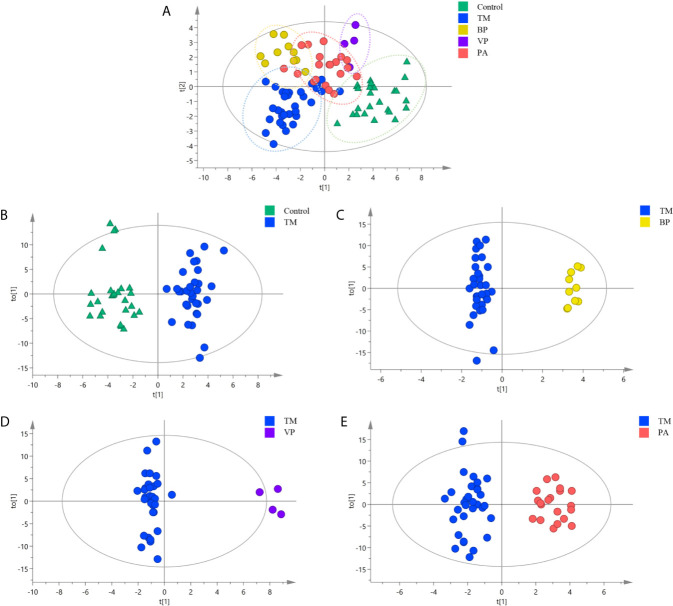
Figure 2.
Orthogonal partial least squares discriminate analysis (OPLS-DA) score plots for discriminating (A) all the sample groups, including healthy controls (Control group) (n = 26), and patients with T. marneffei infection (TM group) (n = 32), with bacterial pneumonia infection (BP group) (n = 10), with viral pneumonia infection (VP group) (n = 4), and with pulmonary aspergillosis infection (PA group) (n = 20) (R2X = 0.869, R2Y = 0.679, Q2 = 0.455); (B) TM group and Control group (R2X = 0.805, R2Y = 0.909, Q2 = 767); (C) TM group and BP group (R2X = 0.836, R2Y = 0.981, Q2 = 0.881); (D) TM group and VP group (R2X = 0.804, R2Y = 0.973, Q2 = 0.836); and (E) TM group and PA group (R2X = 0.769, R2Y = 0.926, Q2 = 0.659).

