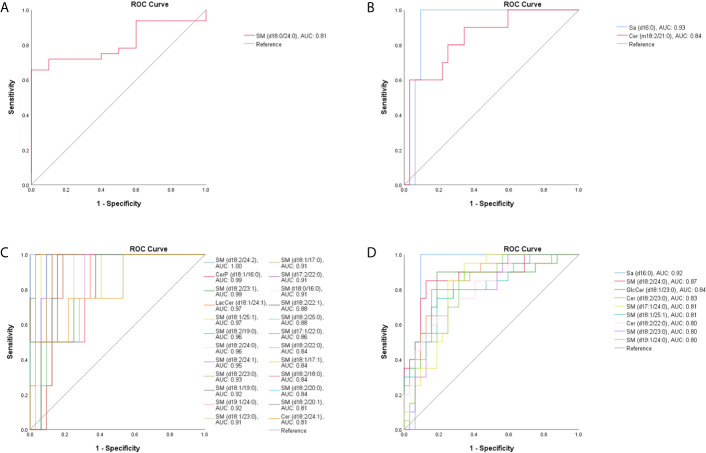
Figure 4.
The ROC curve for SPLs with an AUC value > 0.80. (A) One SPL displayed a higher level and (B) 2 SPLs displayed lower levels in patients with T marneffei infection (TM group) than in patients with bacterial pneumonia. (C) Twenty-four SPLs capable of differentiating TM subjects from patients with viral pneumonia. (D) Nine SPLs that could distinguish TM subjects from patients with pulmonary aspergillosis.

