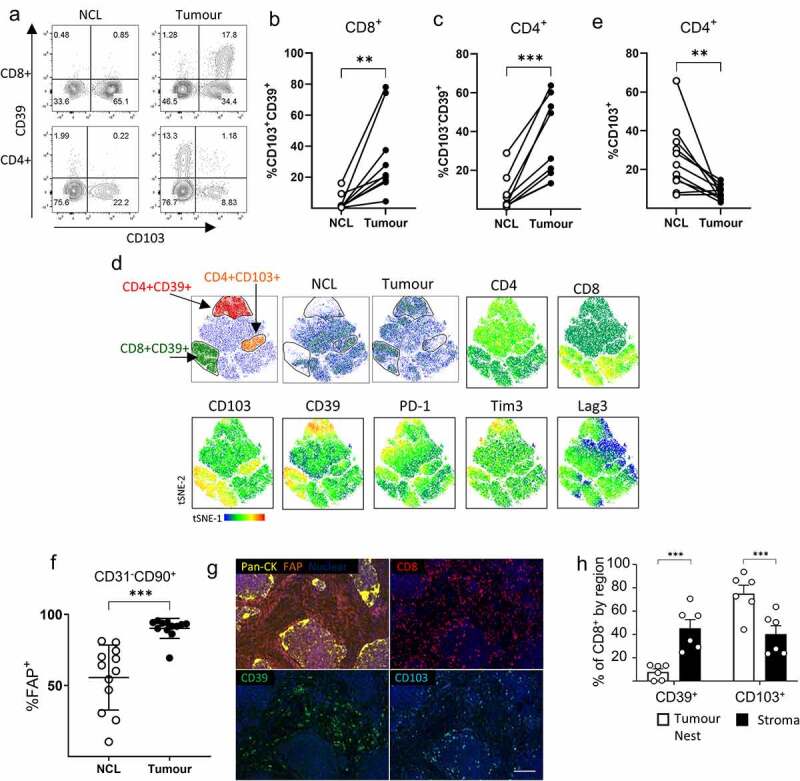
Figure 1.

CAF co-localize with C39+ T cells in the tumor microenvironment. a) Representative staining of CD8+ (upper panels) and CD4+ (lower panels) T cells from paired non-cancerous lung (NCL) or tumor for CD39 and CD103. b) Proportion of CD8+ T cells co-expressing CD39 and CD103 in paired NCL/tumor samples (** P = .005). c) Proportion of CD103-CD39+ cells within CD4+ T cells from paired NCL and tumor samples (n = 9) (*** P = .0007). d) tSNE plots showing concatenated data files gated on CD45+CD3+ T cells from four paired NCL and tumor samples, gates indicate the location of CD8+CD39+ cells, CD4+ CD39+ cells and CD4+ CD103+ cells. The distribution of cells derived from non-cancerous lung (NCL) and tumor samples is shown and heat maps illustrate the relative expression of CD103, CD39, PD-1, Tim3 and LAG3. e) The frequency of CD4+ cells expressing CD103 in paired NCL and tumor samples (n = 11) (** P = .0075). f). FAP expression on CD45-EpCAM−CD31−CD90+ stromal cells derived from NCL or paired tumor samples (n = 12) (*** P = .0005). g). Representative Immunohistochemistry illustrating localistaion of FAP, CD8, CD39 and CD103 expressing cells in a section of NSCLC, scale bar represents 100 µm. h) Distribution of CD39+ and CD103+ CD8+ T cells illustrates enrichment of CD39+ cells within the stroma (*** P = .0008) and CD103+ cells within NSCLC tumors (*** P = .006) (n = 6). Two tailed paired T tests were used for all statistical analyses
