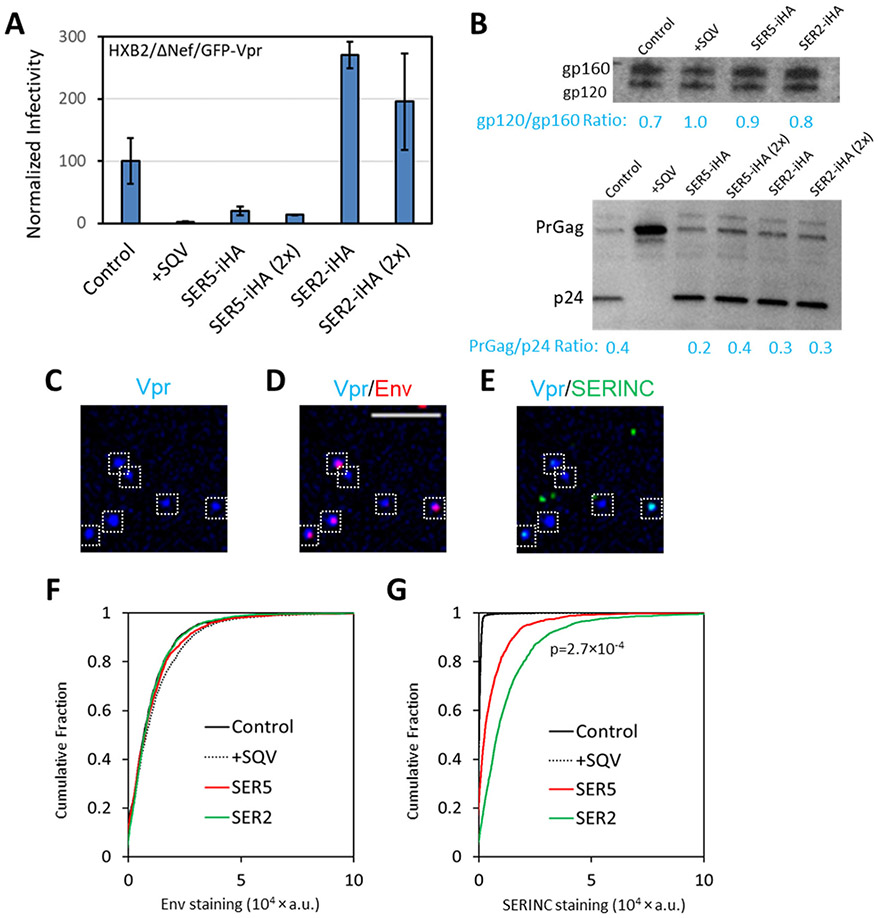
Figure 1. Analysis of Env and SERINC incorporation into pseudoviruses, virus infectivity and maturation.
Four pseudovirus preparations were produced in parallel by transfection of 293T/17 cells and designated as panel A. This panel consisted of control viruses, +SQV (saquinavir treated, immature particles), SER5 and SER2 viruses. For comparison, pseudoviruses were also produced in cells transfected with twice the amount of SER2 or SER5 plasmids. The latter viruses were not used in imaging experiments. (A) Normalized infectivity of pseudoviruses measured by a luciferase reporter assay, using equivalent amounts of p24 to inoculate the cells. (B) Western blotting for HIV-1 gp120 (top) and p24 (bottom) for the virus preparations in the panel. (C-E) SER5-containing viruses were adhered to coverslips, fixed and incubated with anti-gp120 2G12 human (D, F) and anti-HA (SERINC) mouse (E, G) antibodies, followed by staining with anti-human-AF647 and anti-mouse-CF568 antibodies, respectively. White boxes mark particles positive for GFP-Vpr. More than 1,000 single viruses were imaged and analyzed for each preparation of this panel (F, G). SER2 signal was on average twice as strong as SER5 signal with p-value < 0.001, as determined by two-sample Kolmogorov–Smirnov after optimal binning (see Methods). Scale bar: 10 μm.

