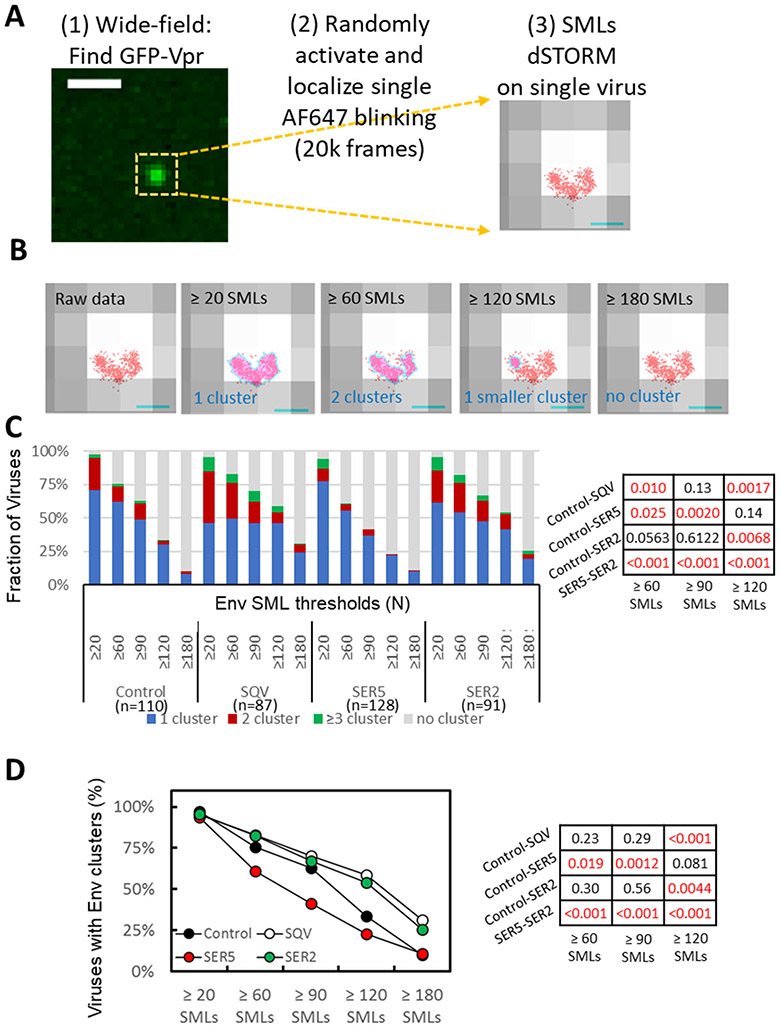
Figure 2. Effect of SERINC incorporation on Env distribution on virions imaged by dSTORM.
(A) Workflow for single virus dSTORM imaging. GFP-Vpr signal was imaged by wide-field fluorescence microscopy to determine the location of single viruses adhered to a coverslip. Samples were then imaged in a dSTORM mode for 20k frames to map single molecule localizations (SMLs, red) associated with single viruses identified by diffraction-limited GFP-Vpr-labeled spot (grey). Scale bar: (Left) 1 μm. (Right) 100 nm. (B) Four panels illustrating the results of DBSCAN analysis of the same virion using different SML thresholds, as indicated, and the search radius 15 nm. Cluster areas are colored light magenta pink with cyan boundaries. Scale bar: 100nm. (C) Distribution of Env clusters as a function of DBSCAN SML threshold categorized into no cluster, 1, 2, and ≥3 clusters per virion. (D) Same as in C but using two virus categories (with/without Env clusters). Statistical comparison for panels C and D is done using Fisher's Exact Test and shown on the right.

