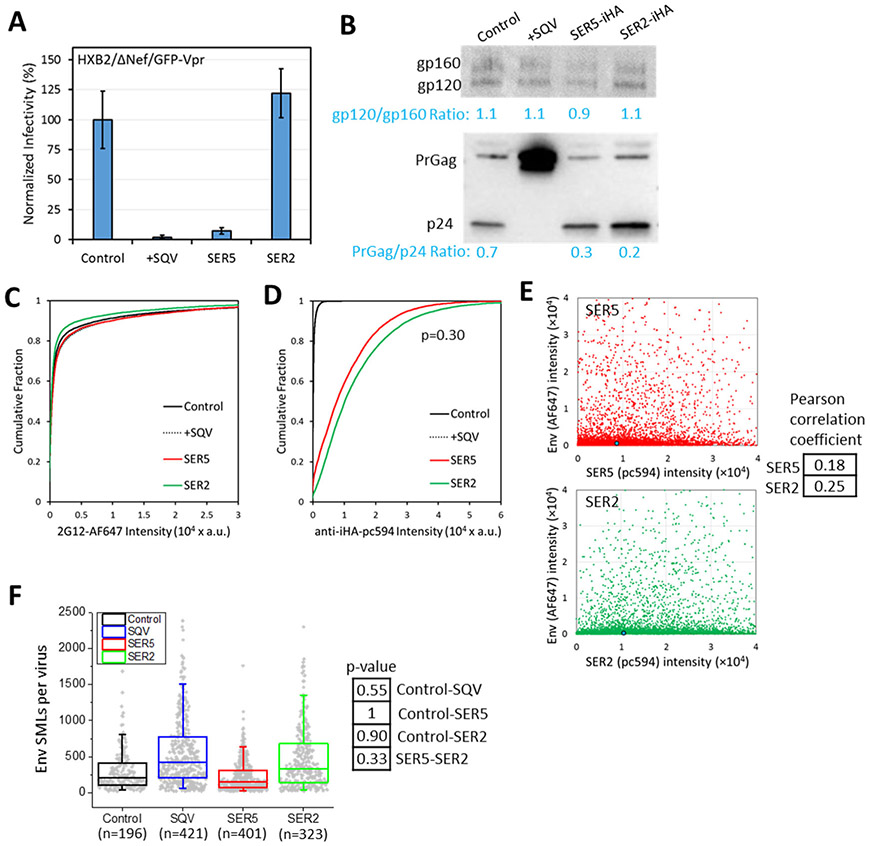
Figure 3. Analysis of Env and SERINC incorporation into pseudoviruses, virus infectivity and maturation.
Four pseudovirus preparations were produced in parallel by transfection of 293T/17 cells and designated panel B, which consisted of control viruses, +SQV (saquinavir treated, immature particles), SER5 and SER2 (viruses containing SERINC5 or SERINC2, respectively). (A) Normalized infectivity of pseudoviruses of the panel measured by fluorescence microscopy as the number of cells expressing the mKate2-reporter gene. (B) Western blot for HIV-1 gp120 (top) and p24 (bottom) of the viruses in the panel. (C, D) Viruses were adhered to coverslips, fixed and incubated with anti-gp120 2G12 human (C) or anti-HA (SERINC) mouse (D) antibodies, followed by staining with AF647- with pc594-conjugated second anti-human and anti-mouse antibodies, respectively. More than 5,000 single viruses were imaged and analyzed for each preparation of this panel. No significant differences between SER5 and SER2 incorporation. (E) No significant correlation is observed between Env and SERINC incorporation (Pearson correlation < 0.3). Blue dot is median (50%) of the intensity. (F) Single molecule localization (SML) distributions per virion for this panel obtained by iPALM. No significant differences were observed between control, SQV, SER5 and SER2 pseudoviruses (p>0.05), using a two-sample Kolmogorov–Smirnov test after optimal binning of data (see Methods). Box plot includes 1st, 2nd, and 3rd quantiles. Whiskers are 5% and 95% values.

