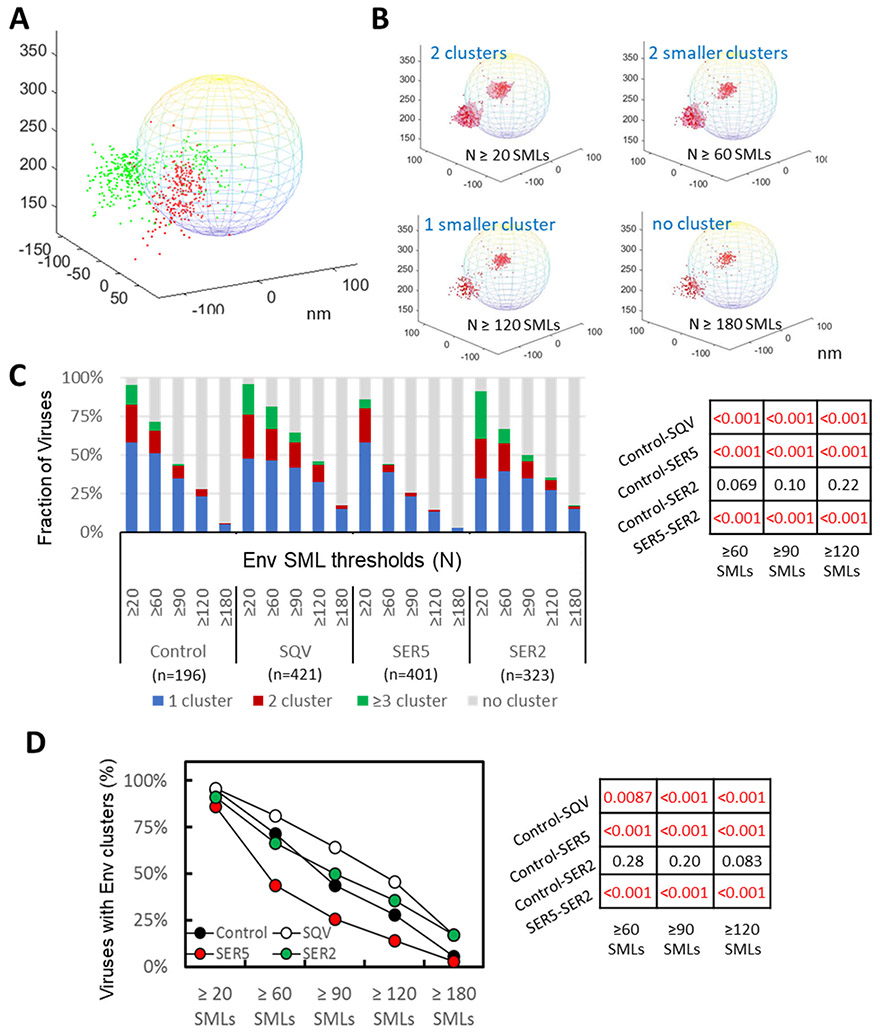
Figure 4. 3D iPALM imaging and analysis of HIV-1 Env distribution on virions.
(A) Illustration of 2-color 3D iPALM imaging on single Env molecule localizations (SMLs, red dots) and SER5 SMLs (green dots) projected onto a 200 nm-diameter sphere representing a GFP-Vpr labeled viral particle. (B) Illustration of Env SMLs (red dots) in 3D overlaid onto an idealized viral particle shown as a sphere with diameter of 200 nm. Dependence of Env clustering (light red area) on the DBSCAN SML threshold N of 20, 60, 120, 180 localizations, and the same searching distance R of 20 nm. X, Y, Z axes are in nm. (C) Analysis of Env clustering for a panel of HIV-1 pseudoviruses consisting of control and immature (SQV) particles and virions containing SER2 and SER5, using different DBSCAN SML threshold parameters, as indicated. The results are categorized into no cluster, 1, 2, and ≥3 clusters per virion. The same R=20 nm for DBSCAN analysis with N=20, 60, 90, 120, 180 localizations. (D) Fraction of pseudoviruses containing or lacking Env clusters (2 categories) for the same DBSCAN parameters as in B. Statistical analyses of data in panel B and C using Fisher's Exact Test are shown on the right.

