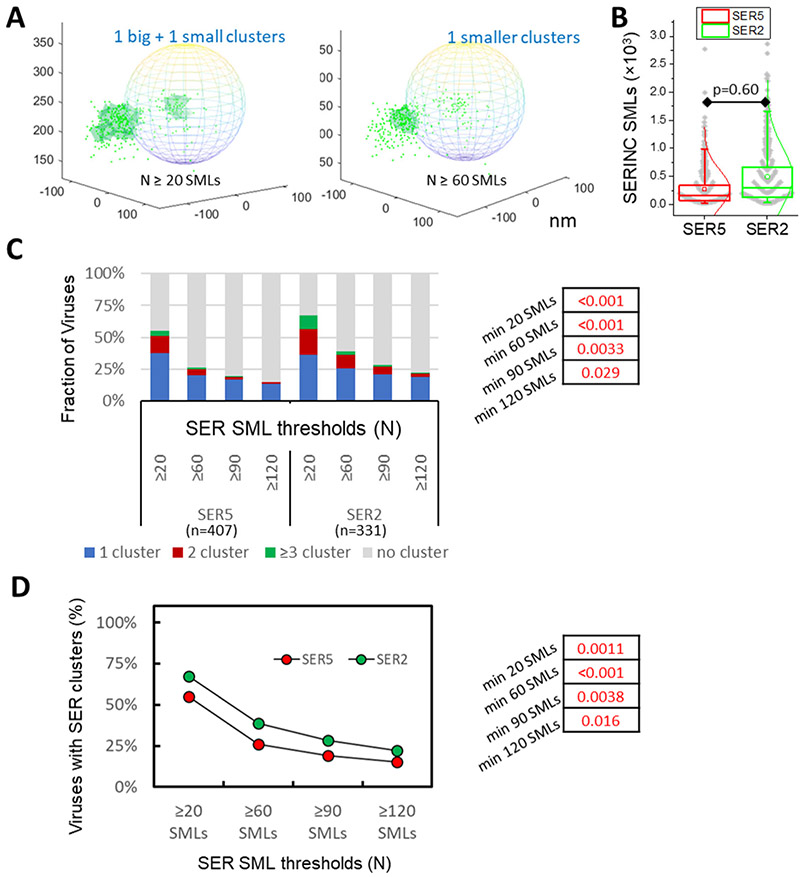
Figure 5. SERINC clustering analysis.
(A) Illustration of single molecule localizations (SMLs) of SER5 (green dots) in 3D overlaid onto an idealized viral particle shown as sphere and dependence of SERINC clustering (light green area) on the DBSCAN SML threshold parameter (N=20 and 60 SMLs and R=20 nm). X, Y, Z axes labels are in nm. (B) Distributions of SMLs per virion are similar for SER5 and SER2. (C) DBSCAN analysis of SER5 and SER2 clustering using a fixed distance parameter (20 nm) and varied SML thresholds, as indicated. Pseudoviruses with less than 20 SER localizations were excluded from analysis. (D) Fractions of pseudoviruses containing or lacking SER clusters (2 categories) as a function of SER SMLs thresholds. Fisher's Exact Test was used for statistical analysis in panels C and D (shown on the right).

