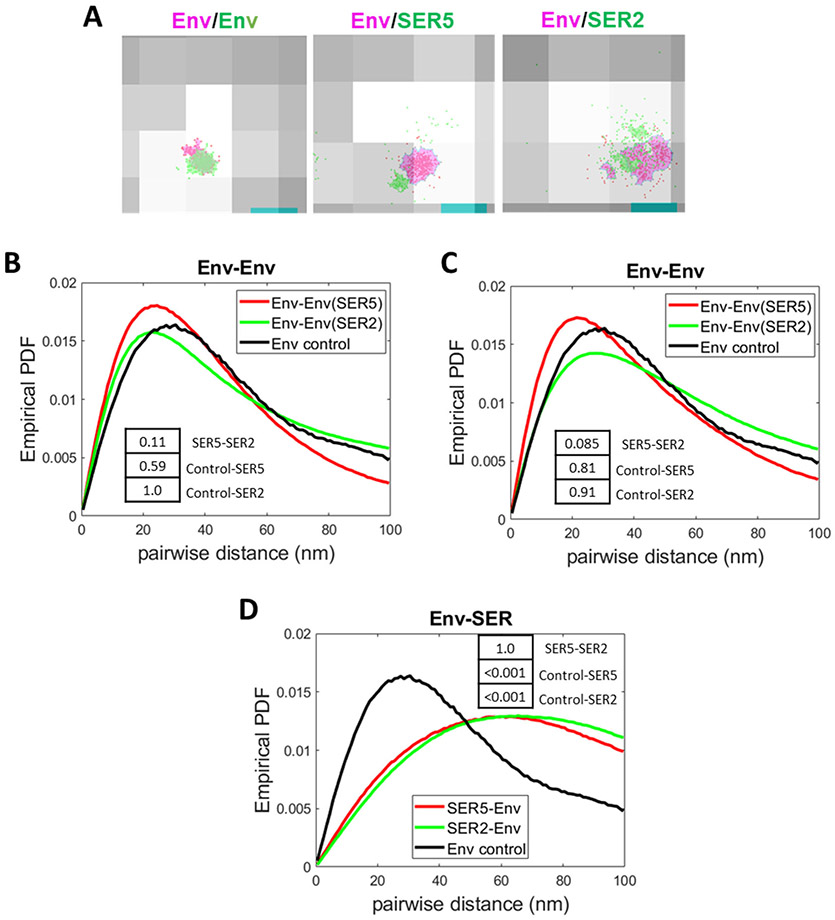
Figure 6. Analysis of Env-SERINC co-distribution on HIV-1 by 2-color iPALM and dSTORM.
(A) Representative images of Env co-stained with both anti-human AF647 (red) and anti-human CF568 (green, left image). The cluster areas are shaded in magenta (AF647) and light green (CF568). Middle and right panels show examples of Env SMLs (red) with a magenta-colored cluster and SER5 SMLs (middle) or SER2 SMLs (right) with a green-colored cluster. Env, SER, and Env co-stained clusters were defined by DBSCAN, R=15 nm and N=20 SMLs. (B) Comparison of probability density function (PDF) of Env-Env pairwise distances between SER5- (red) and SER2-containing viruses (from panel B) imaged by iPALM and projected on a single plane. A pairwise distance distribution for Env control co-stained with two second antibodies is shown for comparison. (C) Comparison of PDF of Env-Env pairwise distances between SER5- (red) and SER2- (green) containing viruses (from panel A) and control Env co-staining obtained by dSTORM. (D) Comparison of PDF of Env-SERINC pairwise distances between SER5- (red) and SER2- (green) containing viruses imaged by iPALM (2D projection). Env-Env distance distribution for control viruses co-stained with a mixture of two second antibodies is shown for comparison. Insets: p-values obtained statistical analysis of the PDF of pairwise distance distributions using two-sample Kolmogorov–Smirnov test after optimal binning (see Methods).

