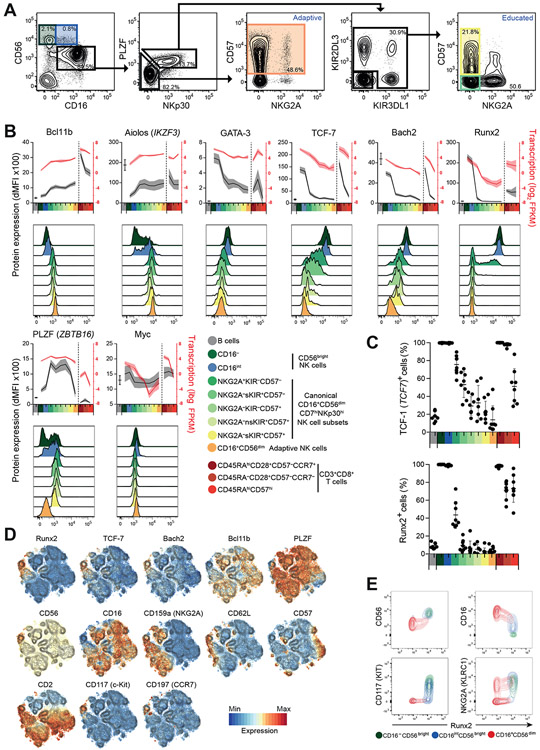
Figure 4. Continuum of transcription factor expression in NK cell differentiation.
(A-E) Intracellular flow cytometric evaluation of selected TFs. (A) Representative gating of NK cell subsets with inclusion of additional CD16intCD56bright cell subset (blue). (B) Graphs depict dMFI values, B-cell values added for comparison, n=8 healthy donors. Histograms from one representative donor. (C) Frequencies of cells expressing specific TFs within B, NK and CD8+ T cell subsets. (D) t-SNE analysis of gated CD3−CD56+ NK cells. (E) Plots depict expression in gated CD16−CD56bright CD16intCD56bright or CD56dim NK cell subsets from a representative donor.

