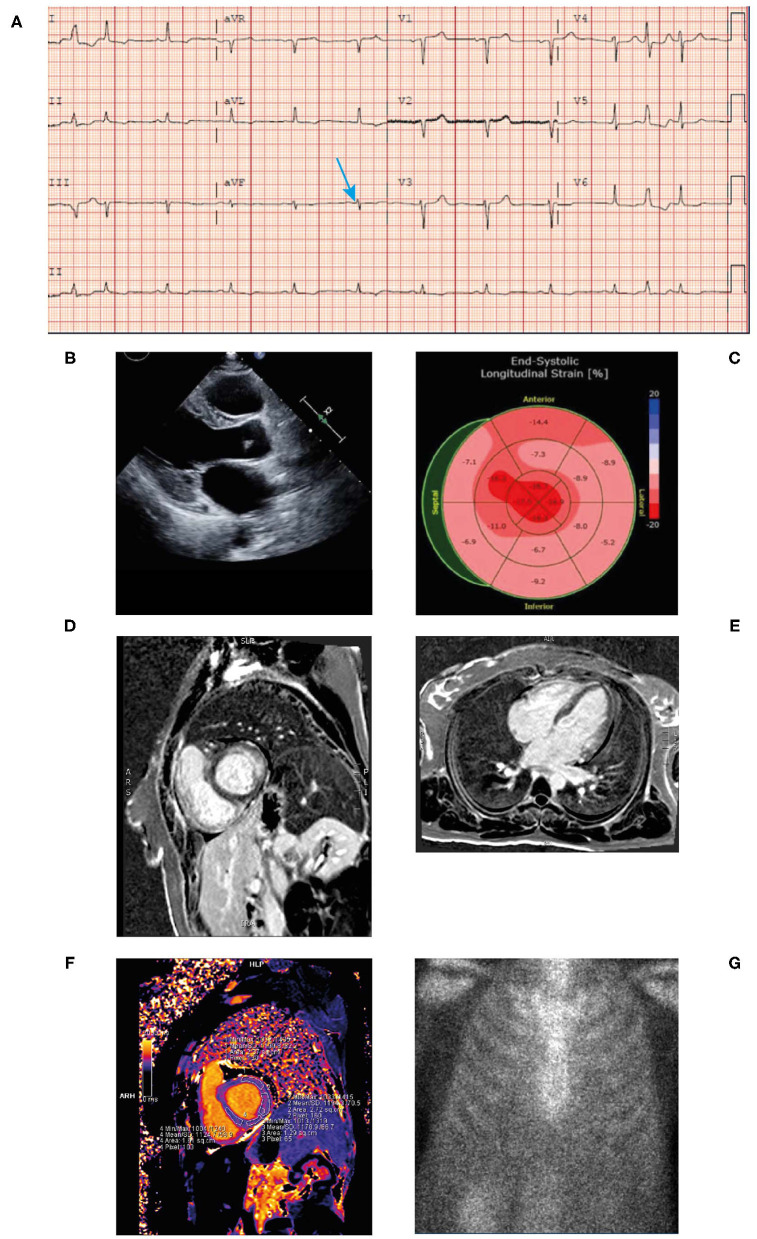
Figure 6.
ECG (A) showing low voltage particularly in the limb leads (blue arrow), atrial premature contraction, sinus rhythm, and poor R-wave progression across the anterior precordial leads. Low voltage discordant with marked LVH. Echocardiogram (B) demonstrating concentric LVH, EF of 50% and left atrial enlargement. End-systolic longitudinal strain (C) showing markedly reduced global longitudinal strain pattern −11.8 with apical sparing. Cardiac MRI (+gadolinium) (D,E) revealing patchy late gadolinium enhancement of mid myocardial lateral wall base, inferior interventricular groove from base to mid ventricle and epicardial enhancement of the lateral wall, septal epicardial enhancement. Epicardial enhancement of entire RV free wall from base to apex. Cardiac MRI T1 mapping (F) showing mildly increased T1 value of left ventricle. Bone scintigraphy (99mTc-PYP) planar 3-h scan (G) had Grade 0 uptake—not suggestive of ATTR. ATTR, transthyretin amyloidosis; ECG, electrocardiogram; EF, ejection fraction; LVH, left ventricular hypertrophy; MRI; magnetic resonance imaging; RV, right ventricular; TTR, transthyretin.

