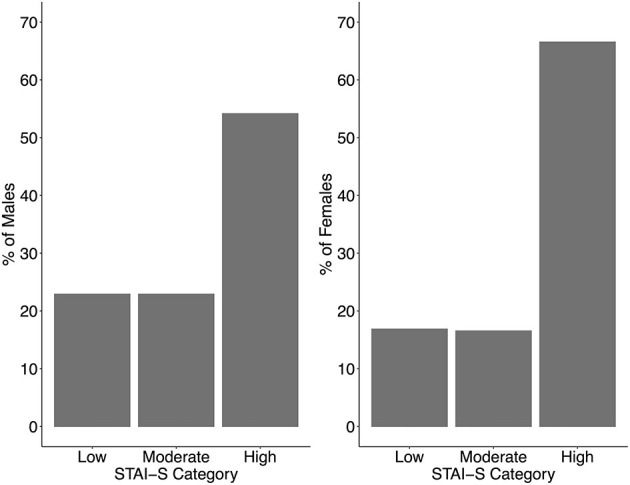
Figure 4.

Percentage of males (n = 144; left panel) and females (n = 634; right panel) scoring in each category of the State Trait Anxiety Inventory—State subscale. Note: the students with gender other than male or female all scored in the High STAI-S category (n = 4).
