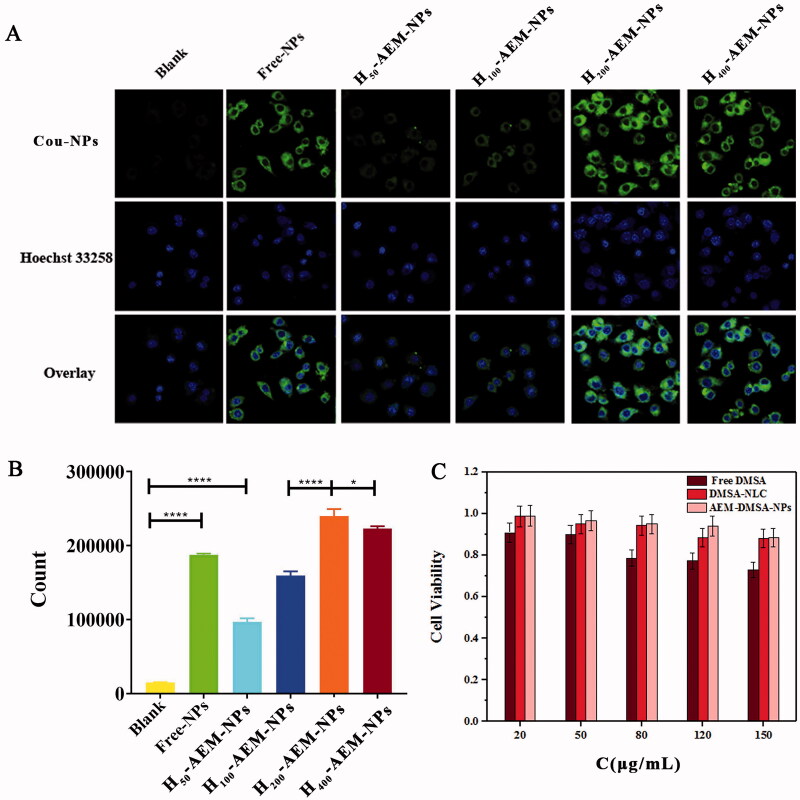
Figure 2.
Cell uptake and cytotoxicity of NPs. (A) After RAW264.7 cells were incubated with coumarin-6 loaded NPs for 2 h and then stained with 4% paraformaldehyde, fluorescent images were observed by confocal microscopy. Scale bar: 50 μm. (B) The fluorescent images were observed using FCM. The data are presented as the means ± SD (n = 3). *indicates p < .05. (C) Cell viability of RAW264.7 cells incubated for 72 h with different concentrations of free-DMSA, DMSA-NLC, and AEM-DMSA-NPs. The data are presented as the means ± SD (n = 3).

